Weekly Corn Market Update 01/27/23
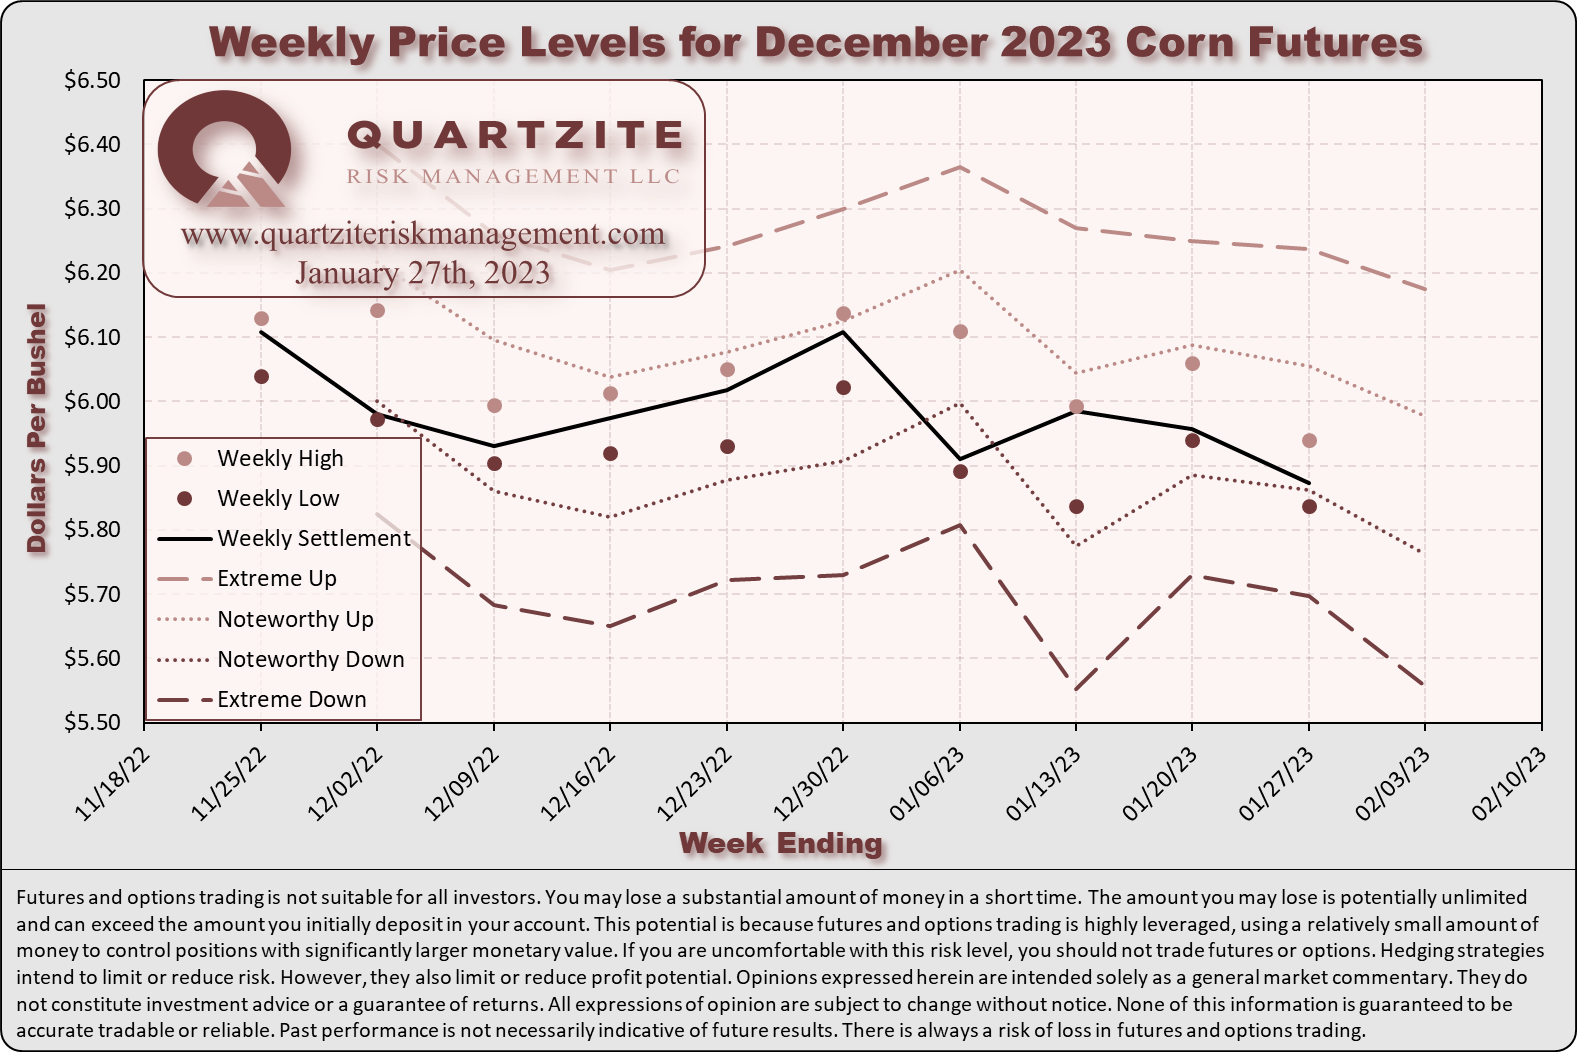
December 2023 (Dec23) corn futures (the benchmark for 2023 corn production) finished the week lower by 8.50 cents (~1.43%), settling at $5.8725/bushel. This week's price action occurred in a 12.00-cent (~2.01%) true range. This week's low was 2.50 cents below the lower notable band we published last week, while the weekly settlement was a penny above that level.
Our corn demand index (CDI) outperformed Dec23 corn futures this week - falling only 1.13%. Dec23 corn futures widened their discount to the CDI again this week. The war in Ukraine, executive branch policy, tensions with China, Federal Reserve interest rate policy, and the Dollar remain concerns.
Depending on one's perspective, Dec23 corn futures are either in a long-term uptrend originating from the spring lows of 2020 or a medium-term downtrend beginning from the spring 2022 highs. However, a comparatively small down move would break that long-term uptrend convincingly. We see technical levels below the market at around $5.84, $5.63, $5.46, $5.14, $4.98, $4.83, $4.63, and $4.20/bushel. We see technical levels above the market at around $6.03, $6.14, $6.31, $6.55, and $6.78/bushel. Daily and weekly momentum indicators mostly settled in neutral territory this week. However, daily and weekly stochastic indicators are flirting with oversold territory. Daily Bollinger Band Bandwidth widened slightly again this week. Carry spreads from Dec23 to Mar24, May24, and Jul24 widened this week. To say the Dec23 technicals are murky is an understatement.
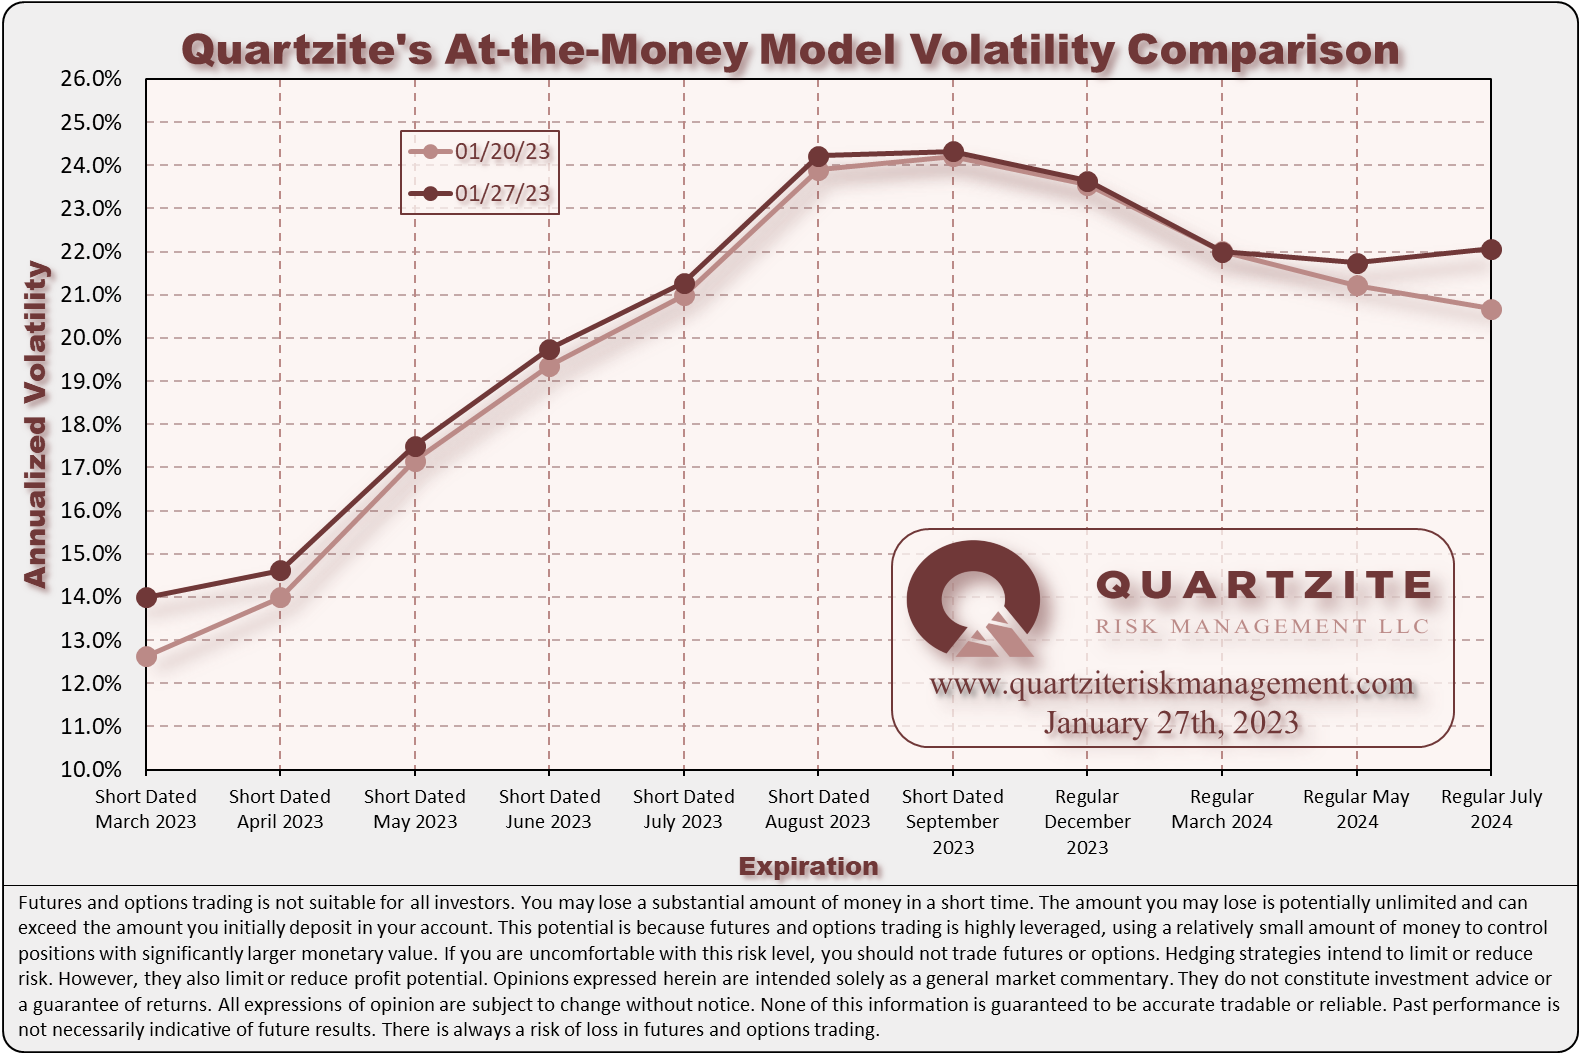
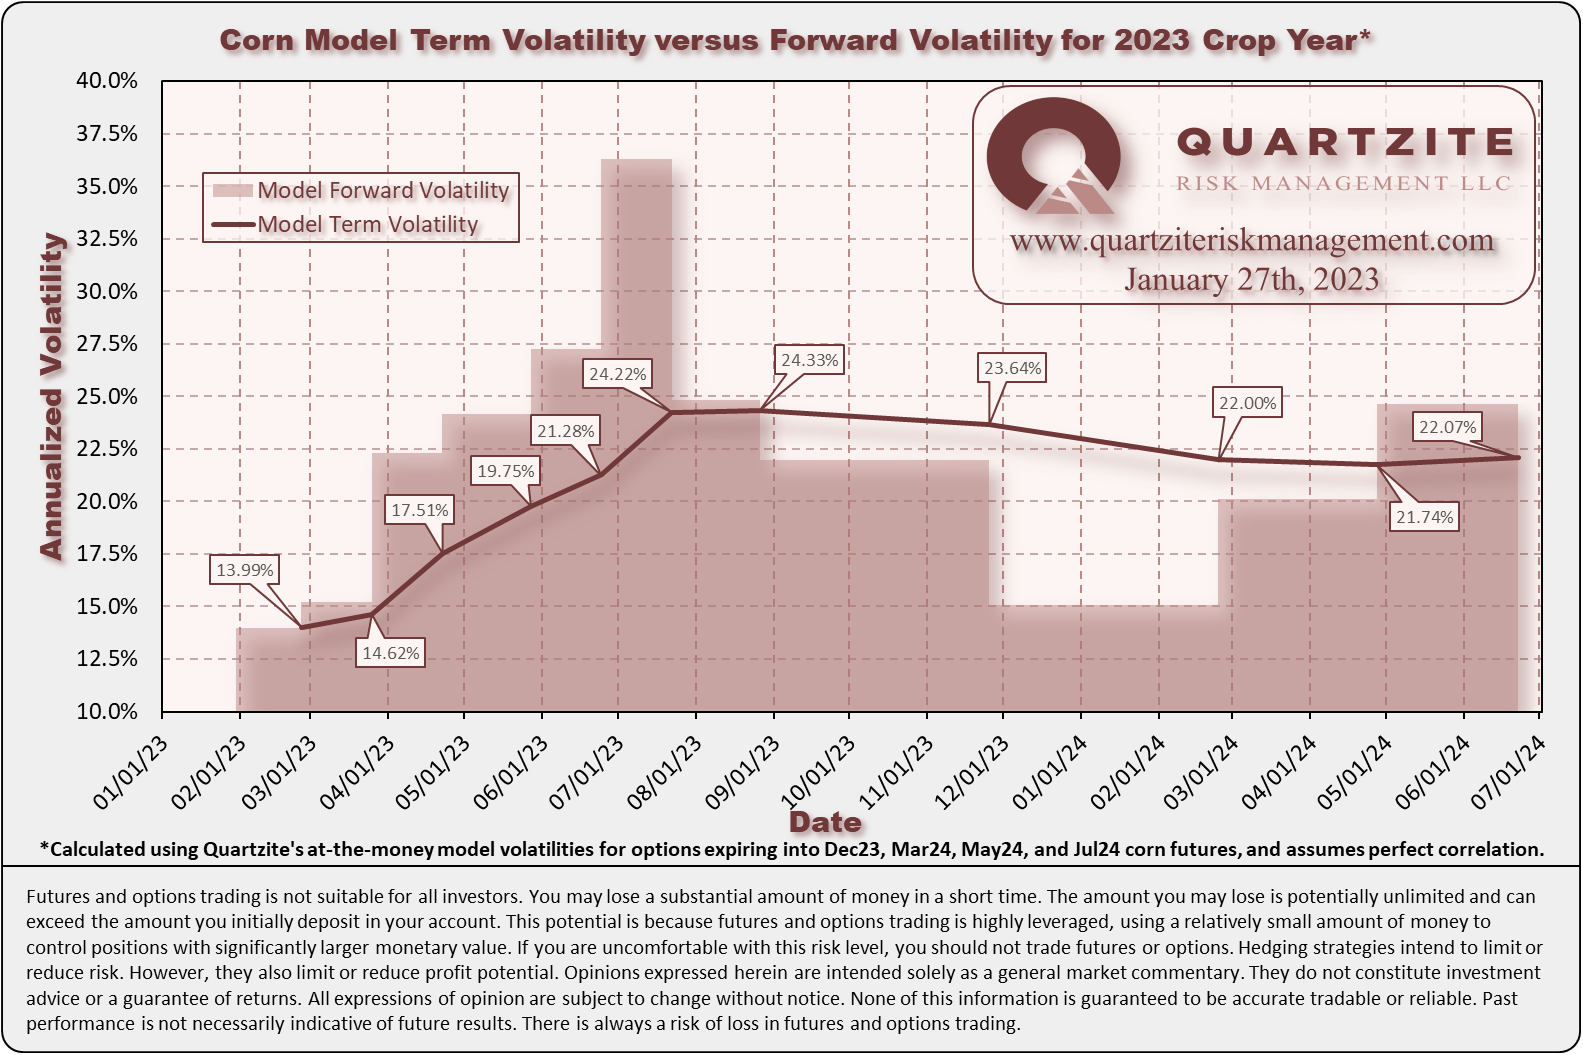
Our at-the-money model volatilities for the 2023 crop mainly finished higher this week. Option volatilities remain cheaper than a year ago, especially in near-term, short-dated new crop options. We are opportunistically looking to add these to our client portfolios. See the charts below for more details. One compares our closing at-the-money model volatilities for this week and last. The other compares our current model volatilities with the forward volatilities they imply between consecutive expirations.
For next week's trading in Dec23 corn futures, we consider trade in the $5.7625-$5.9775 per bushel range unremarkable. Notable moves extend to the $5.5575-$6.1750 per bushel range. Price action beyond that would be extreme. Be sure to visit our Twitter page to vote in the poll we typically hold there each week. While you are there, please give us a follow.
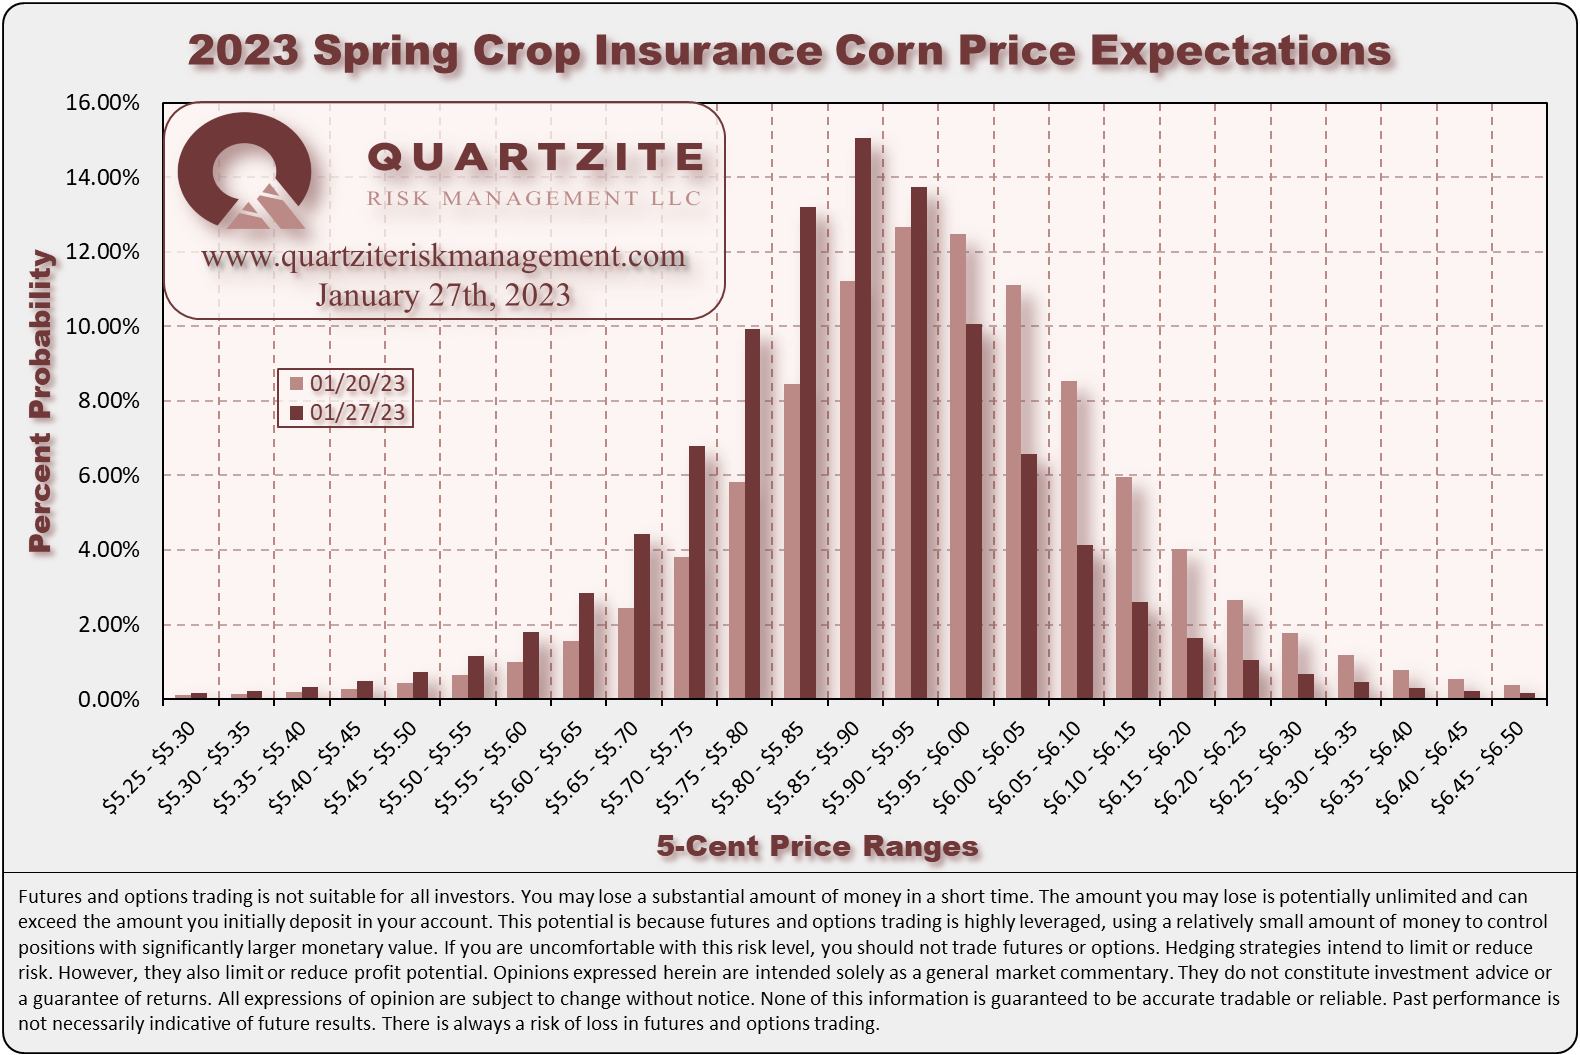
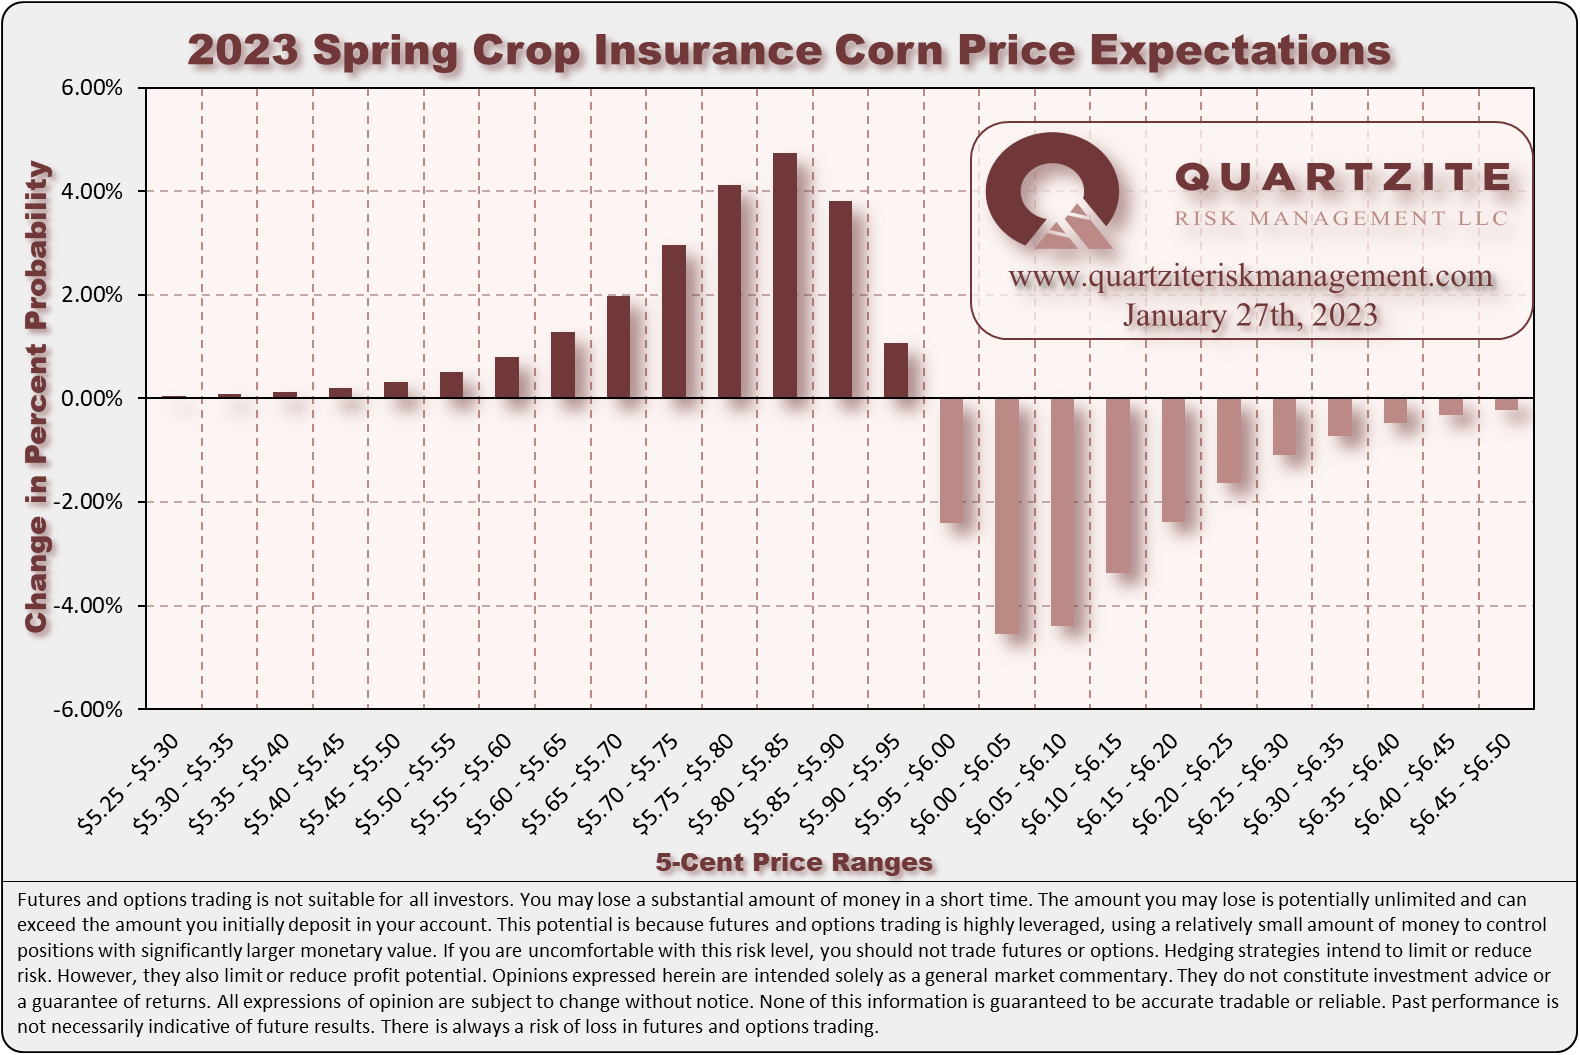
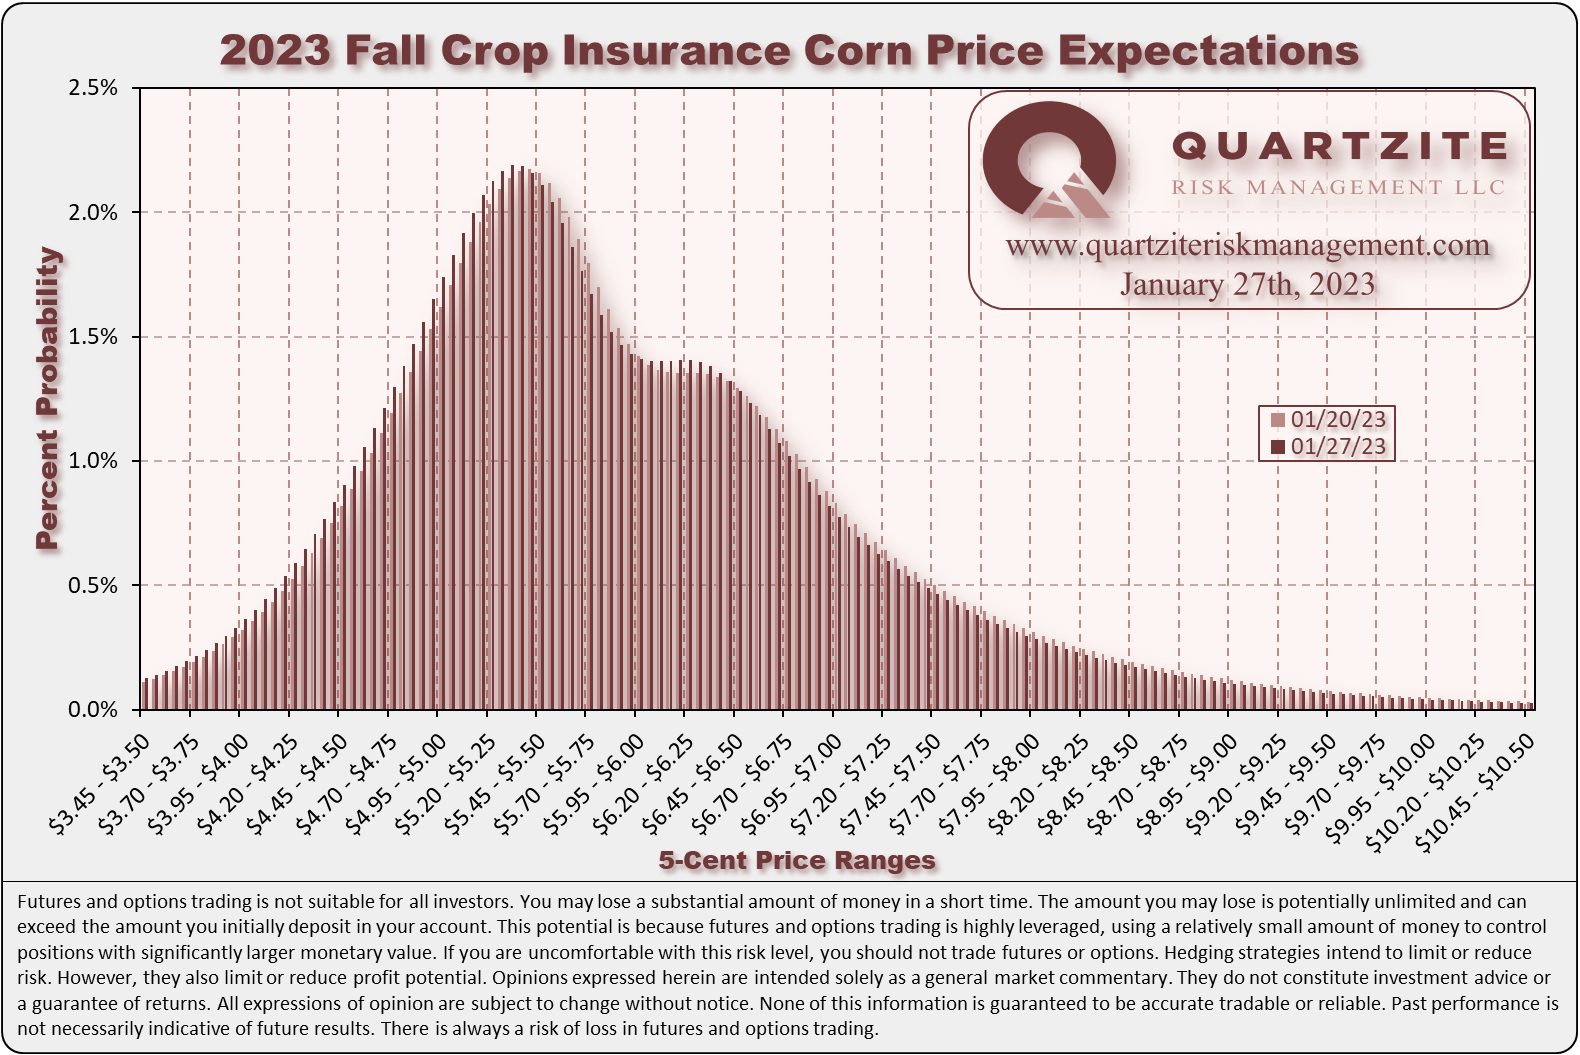
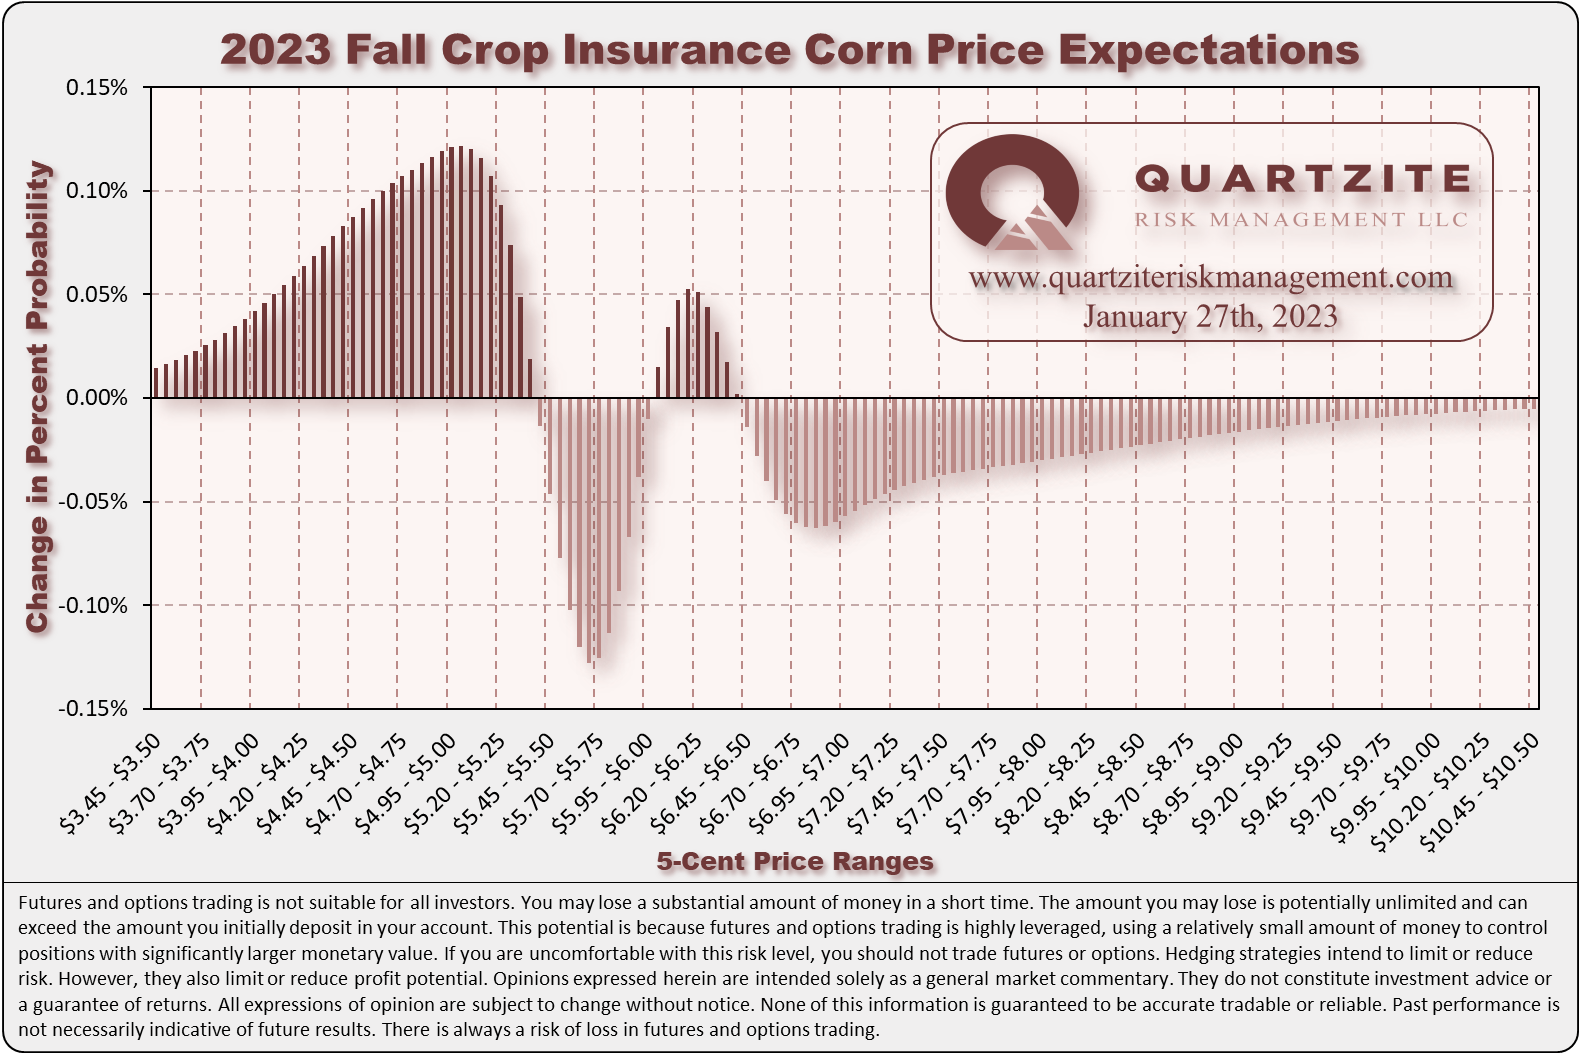
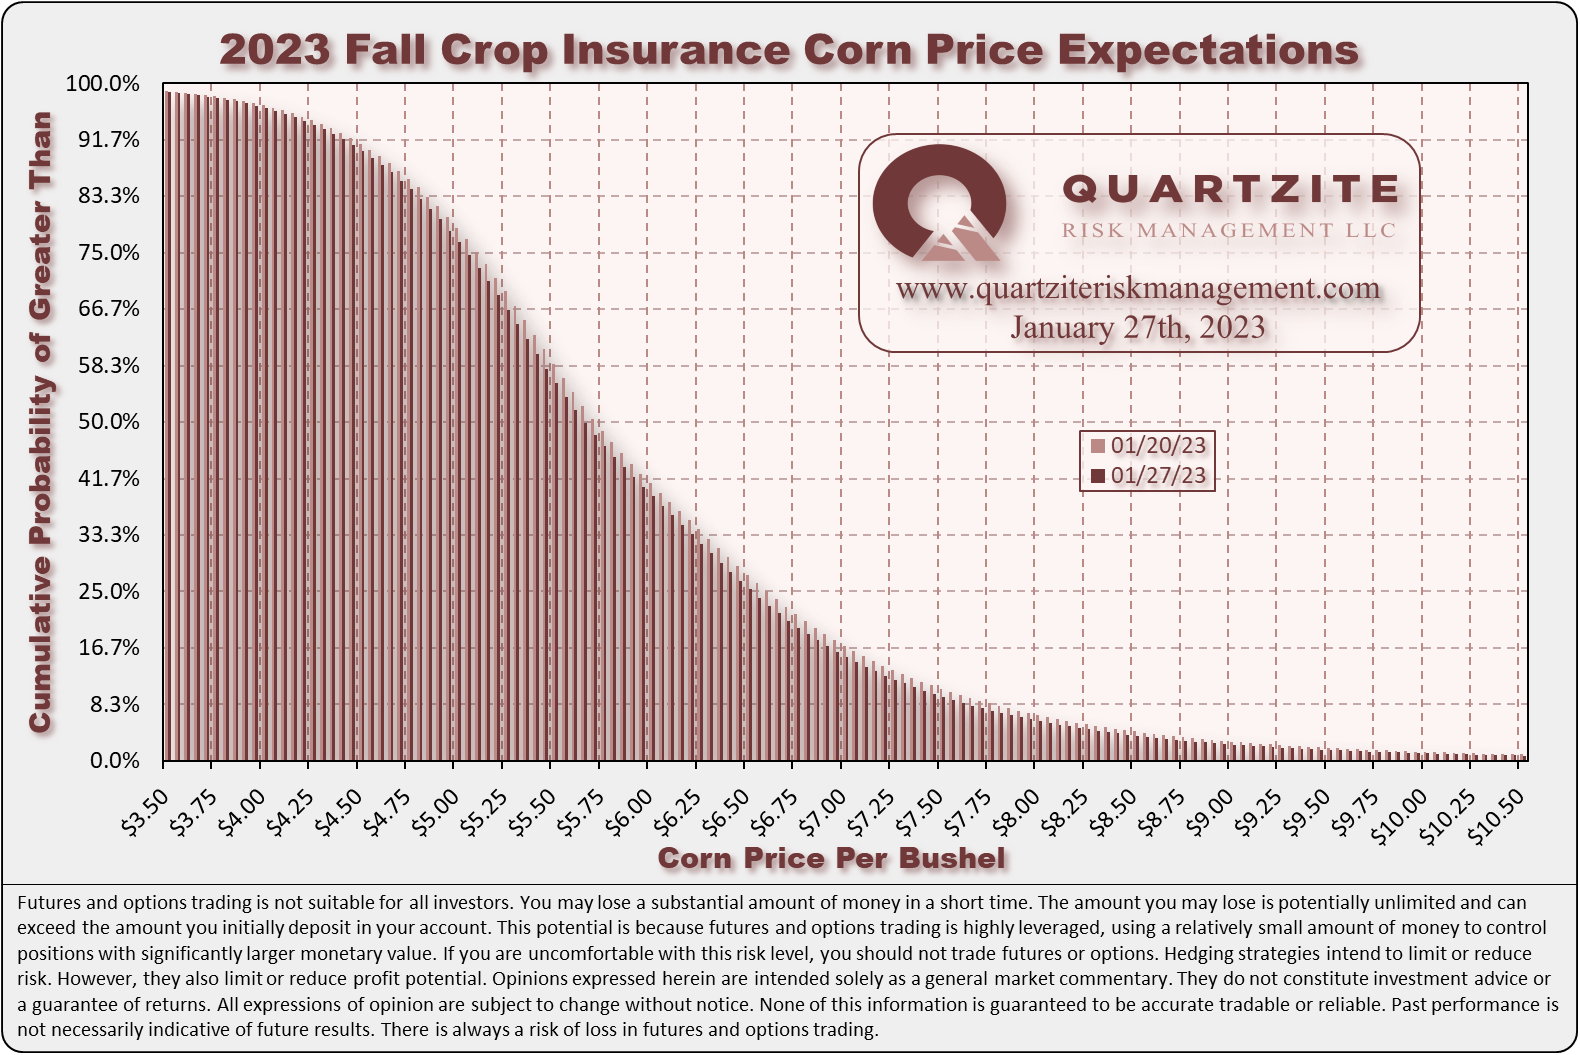
For the spring crop insurance price, we see a median of $5.8750/bushel with a mode between $5.85 and $5.90/bushel. For the fall crop insurance price, we see a median of $5.6475/bushel with a mode between $5.30 and $5.35/bushel. Both distributions shifted lower this week with the decline in Dec23 futures. See the crop insurance charts below.
#AgTwitter & #oatt - cast your vote in this week's poll, then click over to read our Weekly #Corn #Market Update:https://t.co/kbuP9cOfxv
— Quartzite Risk Management LLC (@QuartziteRMLLC) January 28, 2023
We think these scenarios have roughly equal probability next week. Where do you think #cbot Dec23 corn #futures will settle next week?
We made a few trades in the 2023 crop for our Quartzite Precision Marketing customers this week. Early Monday, we made two trades, with futures near our notable downside level. First, we collected a nice premium to roll down the in-the-money short-dated April puts we purchased late last week nearer to at the money. Second, we collected a small premium to roll some in-the-money short-dated March puts down and out to the same near-the-money short-dated April puts as in the first trade. Later in the day, with futures still near our notable downside level for the week, we made a small outright purchase of some out-of-the-money short-dated May calls. The rest of the week was quiet.
We are finalizing the 2023 client roster for our Quartzite Precision Marketing program. We have a few spots left, so if you're interested in working with us for the 2023 growing season, reach out soon.
Thanks for taking the time to read. We look forward to your questions and feedback. Thanks again.
(970)223-5297 - Email - Contact Form - Twitter - Facebook
Weekly Price Levels and Corn Demand Index
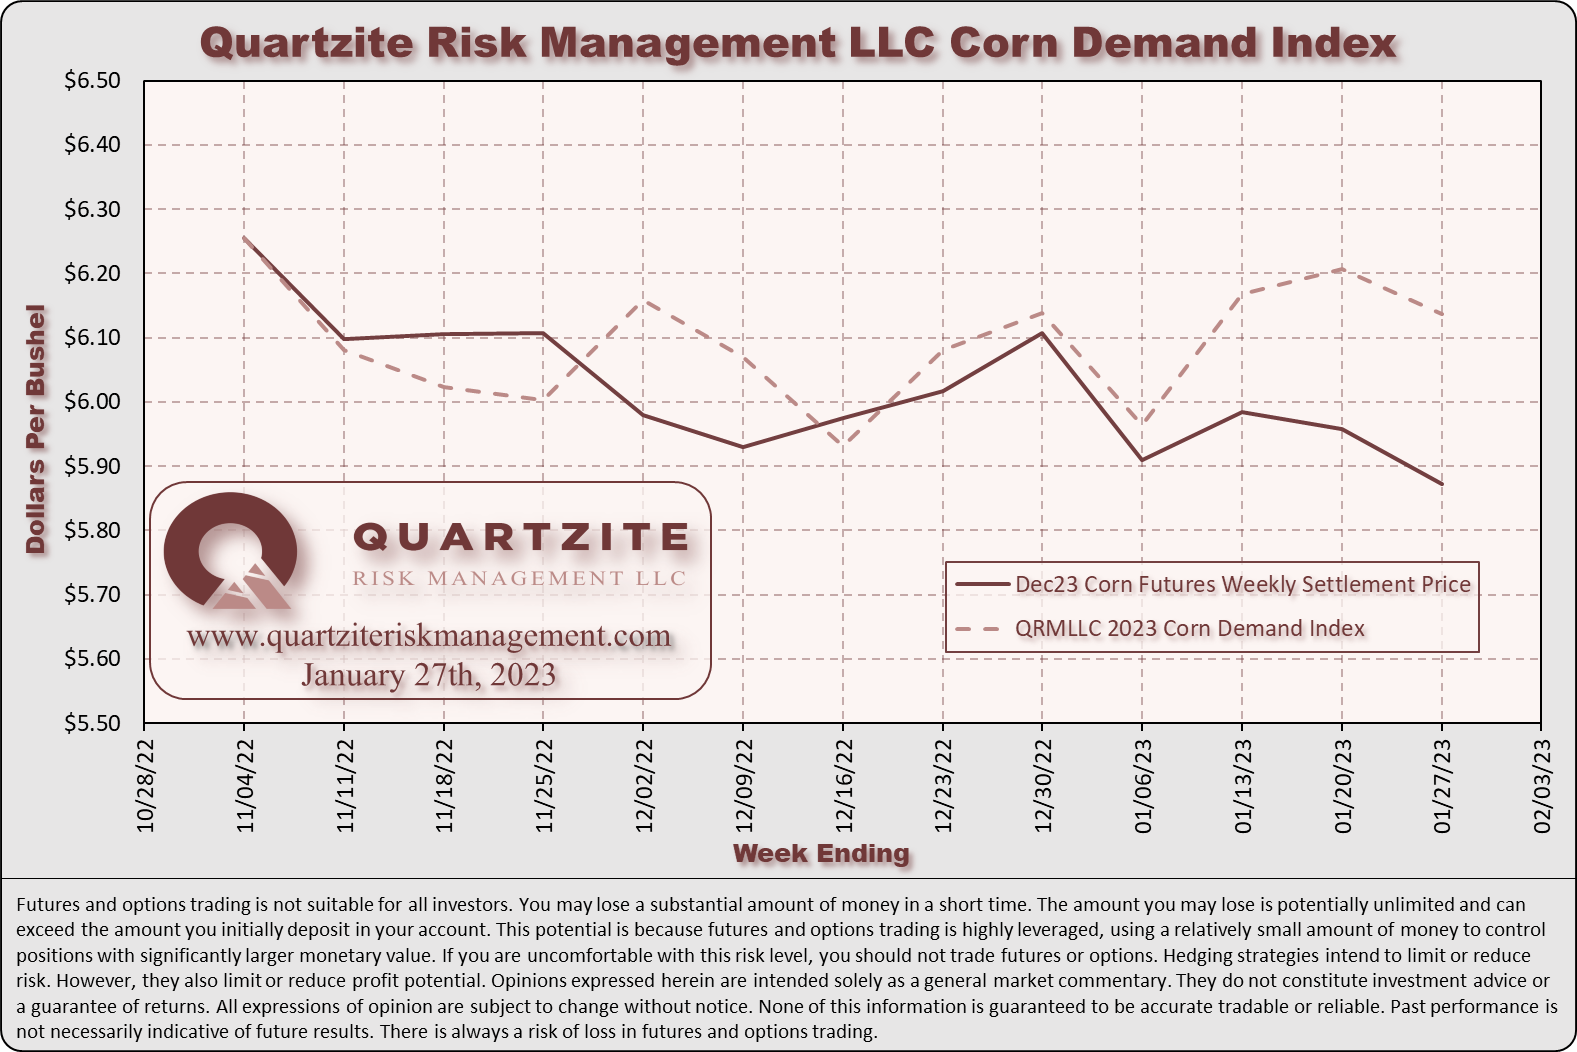
As a reminder, the Quartzite Risk Management Corn Demand Index references the weekly change in April 2024 futures for Crude Oil, Live Cattle and Lean Hogs. We weigh the percentage change in those contracts and compute the index's percentage change. Crude Oil accounts for 50% of the index, and Live Cattle and Lean Hogs each make up 25%. To create the chart, we started the index at the Dec23 corn futures settlement on 11/04/22; then added or subtracted the index's weekly percentage change. We want to add a few warnings. First, there are only a handful of data points - not much to go on. Second, the index references relatively illiquid markets - making any strategy based on it challenging to execute. Third, we expect divergences to increase as we get into the growing season when the corn market will likely look more toward supply for its direction. In short, we would not attempt to trade on this information without much more data, nor would we recommend anyone else does.