Weekly Corn Market Update 01/20/23
December 2023 (Dec23) corn futures (the benchmark for 2023 corn production) finished the week lower by 2.75 cents (~0.46%), settling at $5.9575/bushel. This week's price action occurred in a 12.00-cent (~2.01%) range. This week's trading took place within our unremarkable band.
Our corn demand index (CDI) outperformed Dec23 corn futures this week - rising 0.64%. Dec23 corn futures widened their discount to the CDI this week. The war in Ukraine, executive branch policy, tensions with China, Federal Reserve interest rate policy, and the Dollar are our primary concerns.
Depending on one's perspective, Dec23 corn futures are either in a long-term uptrend originating from the spring lows of 2020 or a medium-term downtrend beginning from the spring 2022 highs. We see technical levels below the market at around $5.84, $5.63, $5.46, $5.14, $4.98, $4.83, $4.63, and $4.20/bushel. We see technical levels above the market at around $6.03, $6.14, $6.31, $6.55, and $6.78/bushel. Daily and weekly momentum indicators mostly settled in neutral territory this week, with the weekly stochastics nearing oversold territory. Daily Bollinger Band Bandwidth widened slightly this week. Carry spreads from Dec23 to Mar24, May24, and Jul24 finished mixed this week. To say the Dec23 technicals are murky is an understatement. We see no technical reason to maintain directional exposure to the Dec23 corn market, up or down.
Our at-the-money model volatilities for the 2023 crop finished lower this week. Option volatilities are cheaper than a year ago, especially in near-term, short-dated new crop options. We are opportunistically looking to add these to our client portfolios. See the charts below for more details. One compares our closing at-the-money model volatilities for this week and last. The other compares our current model volatilities with the forward volatilities they imply between consecutive expirations.
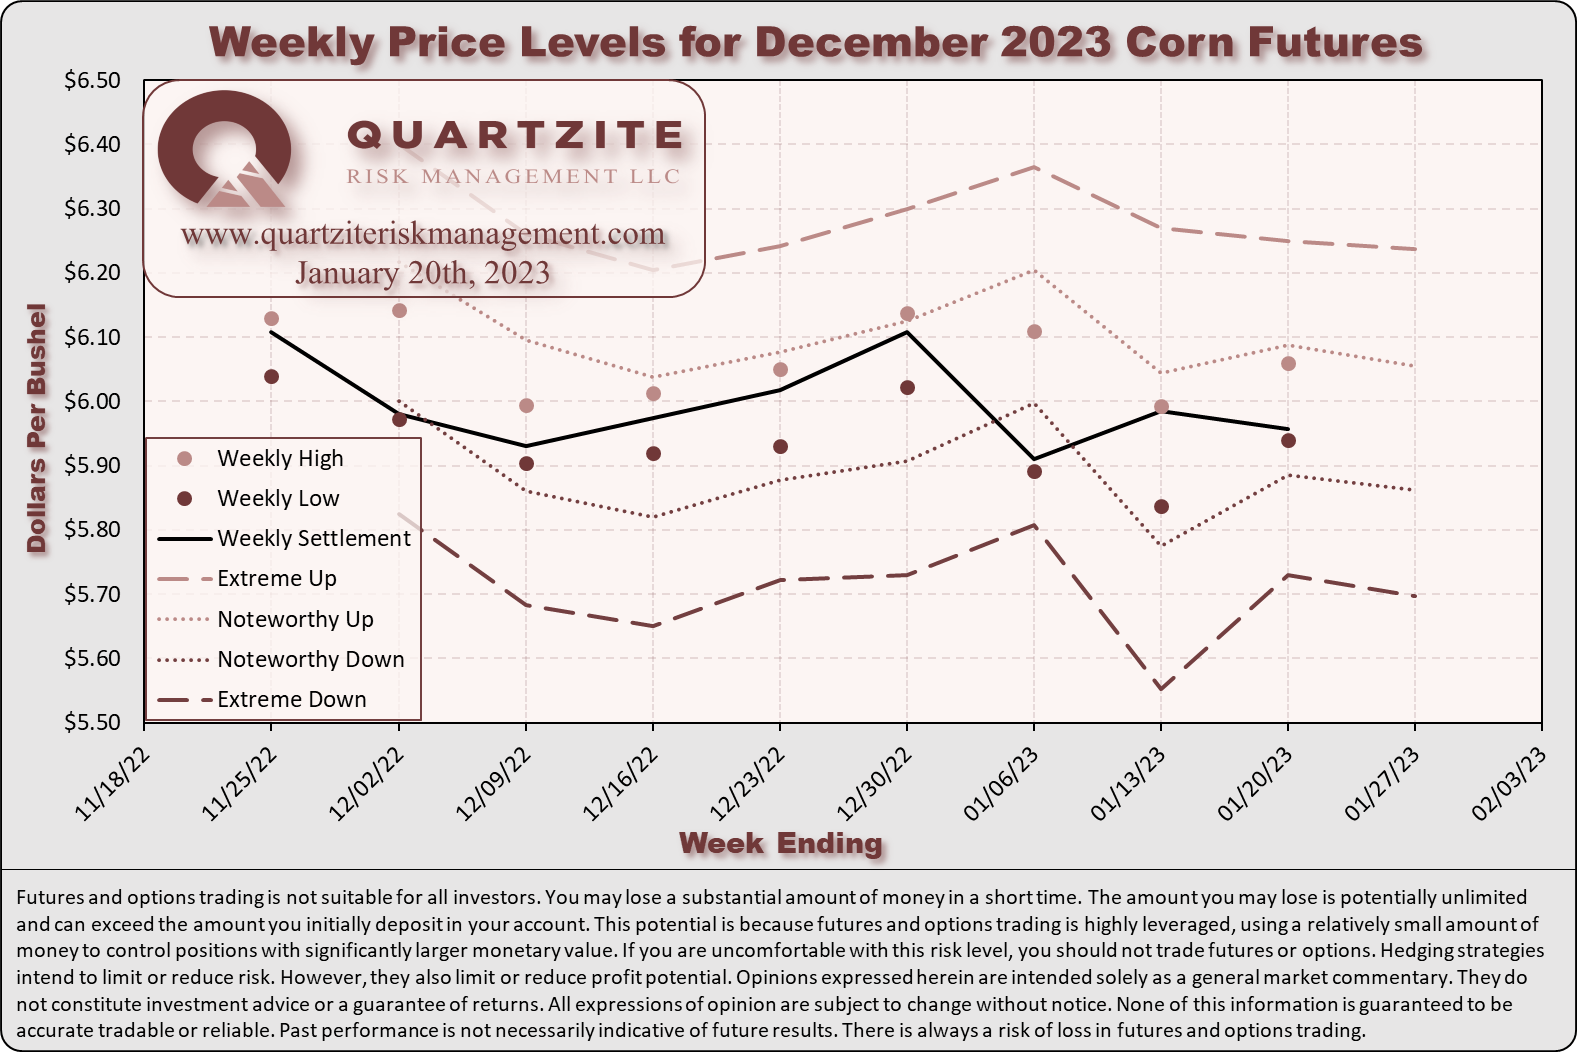
For next week's trading in Dec23 corn futures, we consider trade in the $5.8625-$6.0550 per bushel range unremarkable. Notable moves extend to the $5.6975-$6.2375 per bushel range. Price action beyond that would be extreme.
For the spring crop insurance price, we see a median of $5.9525/bushel with a mode between $5.90 and $5.95/bushel. For the fall crop insurance price, we see a median of $5.7150/bushel with a mode between $5.40 and $5.45/bushel. Both distributions narrowed this week from decreases in implied volatility. See the crop insurance charts below.
Our Quartzite Precision Marketing client portfolios came into this week with a smattering of near-the-money puts in the short-dated Mar23 and short-dated May23 series. Additionally, they have some upside call calendar spreads from short-dated Aug23 and Sep23 expirations to the Dec23 expiration. They also own some outright "tail-risk" calls in the Dec23 expiration. Many of our clients have made hard sales (cash and futures contracts) against their 2023 production to various degrees. On Friday, we added to the puts we manage for our clients with an outright purchase of near-the-money short-dated Apr23 puts.
We are finalizing our 2023 client roster for the Quartzite Precision Marketing program. We have a few spots left, so if you're interested in working with us for the 2023 growing season, reach out soon.
Thanks for taking the time to read. We look forward to your questions and feedback. Thanks again.
(970)223-5297 - Email - Contact Form - Twitter - Facebook
Weekly Price Levels and Corn Demand Index

As a reminder, the Quartzite Risk Management Corn Demand Index references the weekly change in April 2024 futures for Crude Oil, Live Cattle and Lean Hogs. We weigh the percentage change in those contracts and compute the index's percentage change. Crude Oil accounts for 50% of the index, and Live Cattle and Lean Hogs each make up 25%. To create the chart, we started the index at the Dec23 corn futures settlement on 11/04/22; then added or subtracted the index's weekly percentage change. We want to add a few warnings. First, there are only a handful of data points - not much to go on. Second, the index references relatively illiquid markets - making any strategy based on it challenging to execute. Third, we expect divergences to increase as we get into the growing season when the corn market will likely look more toward supply for its direction. In short, we would not attempt to trade on this information without much more data, nor would we recommend anyone else does.


