Weekly Corn Market Update 01/08/21
December 2021 (Dec21) corn futures (the benchmark for 2021 corn production) finished the week higher by 5.75-cents (~1.32%), settling at $4.4050/bushel. This week's price action took place in a 12.75-cent (~2.93%) range. All of this week's trading took place within the unremarkable band we published last week. Dec21 corn futures set another contract high this week at $4.4400/bushel.
Our corn demand index was up 2.53% this week, outperforming Dec21 corn futures and catching up after two weeks of underperformance. Fundamental discussions should still note concerns over COVID-19 and uncertainty surrounding future executive branch policy. These two factors continue to provide potential sources of volatility. They are of particular concern where they might impact U.S. and Chinese trade relations. The USDA's monthly WASDE and Crop Production reports and its quarterly and annual Grain Stocks reports could significantly impact markets next Tuesday.
Technically speaking, Dec21 corn futures remain in an uptrend that started from the August 2020 lows. Both daily and weekly momentum indicators remain in extremely overbought territory. Additionally, Dec21 corn futures continue to extend their upside breach of the channel that has contained the rally from August until the last three weeks. We still would not be surprised to see a pullback to the $4.10-$4.12/bushel range.
Liquidity in the short-dated options market for the 2021 crop year is improving in places, though still somewhat illiquid. Adequate liquidity in the Dec21 options expiration continues. We used the rally this week as an opportunity to roll some of the short-dated March puts we held for clients up and out to near-the-money short-dated June puts. Implied volatility for options on the 2021 corn crop jumped this week, with nearer-term expirations leading the way. Given the high prices of options, we would use the minimum number necessary to manage production uncertainty. We continue to believe that implied volatility has not risen to the point where a speculative short volatility bet is justified. We believe the short-dated May and June expirations offer the best value for hedgers. Liquidity concerns could still prevent establishing positions at favorable levels, making quality execution essential. See the chart below for a comparison of our closing at-the-money model volatilities for this week and last.
Looking ahead to next week for Dec21 corn futures, we would consider movement within the $4.2475-$4.5750 per bushel range to be unremarkable. Notable moves would extend to the $4.0650-$4.7775 per bushel range. Price action beyond that would be extreme. As promised, you will find a chart comparing these levels to the corresponding weekly price action below. Be sure to visit our Twitter page to vote in the poll we hold there each week. While you are there, please give us a follow.
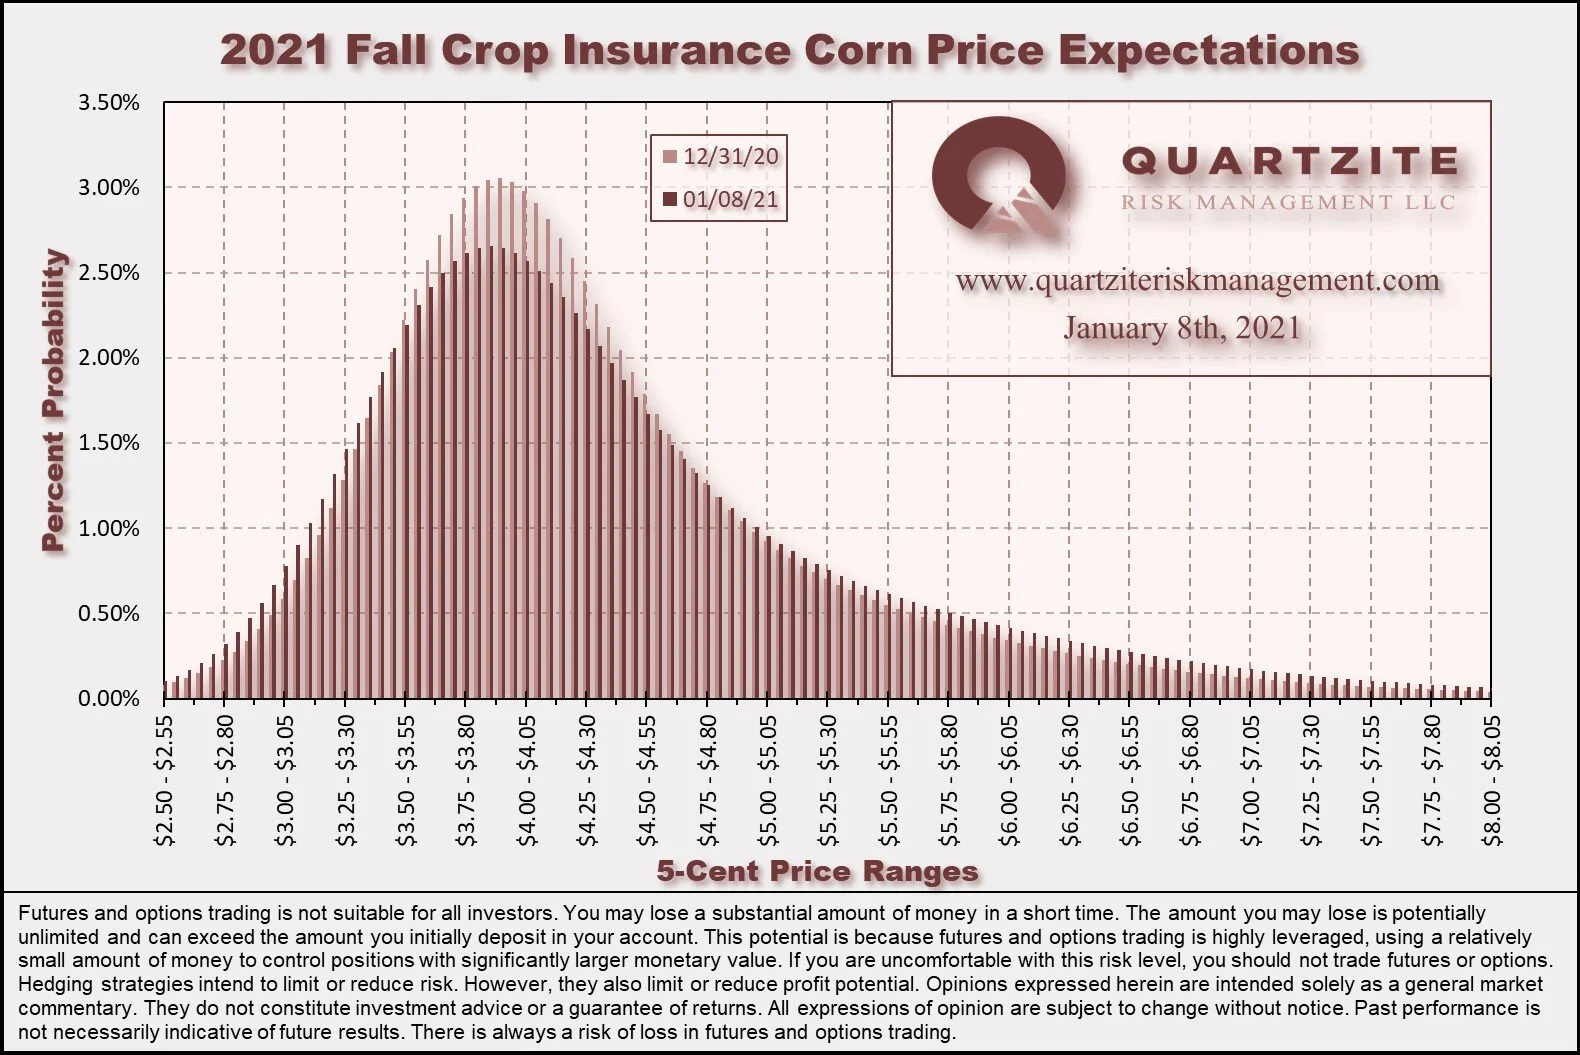
Looking at the Spring and Fall prices for crop insurance this week, both distributions shifted slightly higher due to the rally. They also broadened considerably, given the increase in implied volatility. See below for distribution and cumulative probability charts for both the Spring and Fall crop insurance prices.
As promised, we added a new article to the Tools and Tactics section this week. "Theta - Part Two" is now available.
Lastly, we would like to take a few seconds to remind you that now is the time to be thinking about your 2021 marketing plan. We usually begin hedging for our Quartzite Precision Marketing clients in February while the spring crop insurance price is setting. The account opening process can take a few weeks, which does not leave much time. We think it is better to be a week early than a week late. So, if you want to learn more, give us a call.
Thanks for taking the time to read. We look forward to your questions and feedback. Please feel free to contact us via our contact form, Facebook, Twitter, email, or phone at (970)294-1379. Thanks again. Have a great week.