Weekly Corn Market Update 10/14/22
December 2022 (Dec22) corn futures (the benchmark for 2022 corn production) finished the week higher by 6.50-cents (~0.95%), settling at $6.8975/bushel. This week's price action occurred in a 26.50-cent (~3.88%) range. This week's trading fell entirely within the unremarkable band we published last week. This week was the fifth straight week and sixth week out of the last seven weeks where all trading took place within our unremarkable band.
Our corn demand index (CDI) underperformed Dec22 corn futures this week, falling 2.95%. Dec22 corn futures' premium over the CDI widened this week. It returned to an exceptionally elevated level - the fourth-widest premium of the year. The war in Ukraine, executive branch policy, tensions with China, Federal Reserve interest rate policy, and the strengthening Dollar remain concerns. The USDA released its monthly WASDE report on Wednesday.
Dec22 corn futures remain above the long-term trendline connecting the lows of 03/31/21 and 09/10/21. However, this week they again flirted with a shorter-term trendline connecting the lows of 07/22/22 and 08/18/22 - settling just below it. We see support below the market at around $6.88, $6.58, $6.47, $6.30, $5.99, and $5.80/bushel. Significant long-term support is between $5.26 and $5.35 per bushel. We see resistance above the market around $6.99, $7.04, $7.14, $7.27, $7.37, $7.57, and $7.66/bushel. Daily momentum indicators settled in neutral territory again this week. Weekly momentum indicators remained in neutral to overbought territory. Daily Bollinger Band Bandwidth widened slightly this week but remained very tight overall. Carry spreads from Dec22 to Mar23, May23, and Jul23 narrowed this week.
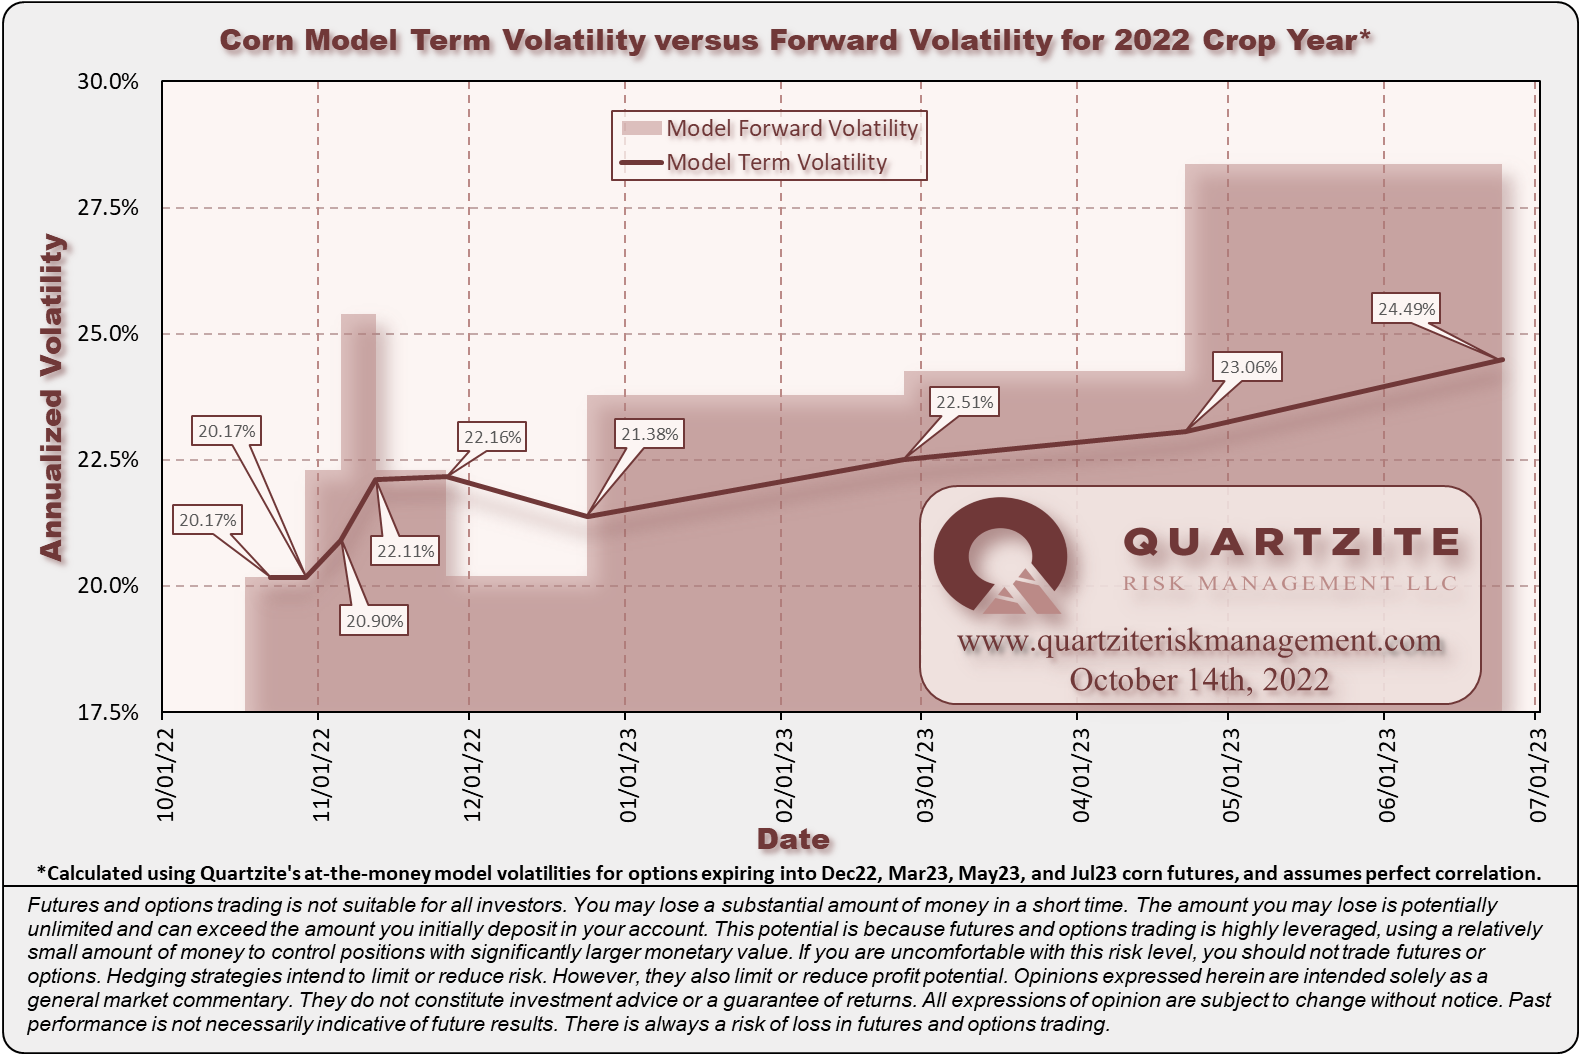
Our at-the-money model volatilities for the 2022 crop finished lower this week. Option volatilities remain near some of their lowest levels of the year. It may be an excellent time to purchase options if needed. We still think properly managing options at these levels requires opportunistic spreading and careful position management to manage production uncertainty and volatility risk. See the charts below for more details. One compares our closing at-the-money model volatilities for this week and last. The other compares our current model volatilities with the forward volatilities they imply between consecutive expirations.
For next week's trading in Dec22 corn futures, we consider trade in the $6.7000-$7.1075 per bushel range unremarkable. Notable moves extend to the $6.4625-$7.3750 per bushel range. Price action beyond that would be extreme. Be sure to visit our Twitter page to vote in the poll we hold there each week. While you are there, please give us a follow.
The discovery period for the Fall Crop Insurance Price continued this week. The average is currently $6.8783 per bushel, with 47.6% of the observations accumulated.
This week, we made several trades in the corn market for our Quartzite Precision Marketing customers. On Monday's rally, we rolled the November puts that constituted the bulk of our position up to just below the money with a vertical put spread. On Friday morning, we purchased some dollar-cheap, expiring, Week-2 October puts. We tried to trade around them late in the day as we broke through the strike but ultimately didn't get much out of them because of partial fills - we should have been more aggressive. Also, late in Friday's day session, we paid a small premium to move the now-in-the-money November puts down and out to slightly out-of-the-money December puts. Our listed hedges for the 2022 crop year are now entirely in the December expiration. We still think producers should protect their investment with a disciplined and flexible risk management strategy like the one at the heart of Quartzite Precision Marketing. Now is the right time to consider your 2023 marketing plan. We're accepting new customers for the 2023 crop year, but space is limited, so contact us soon if you're interested. If you have any questions or want to learn more about what we do, we are always happy to chat about the markets, and there is no obligation.
#AgTwitter & #oatt - cast your vote in this week's poll, then click over to read our Weekly #Corn #Market Update:https://t.co/2EdkoDAtBf
— Quartzite Risk Management LLC (@QuartziteRMLLC) October 15, 2022
We think these scenarios are equally likely for next week. Where do you think Dec22 corn #futures will settle next week?
Thanks for taking the time to read. We look forward to your questions and feedback. Thanks again.
(970)223-5297 - Email - Contact Form - Twitter - Facebook
Weekly Price Levels and Corn Demand Index


As a reminder, the Quartzite Risk Management Corn Demand Index references the weekly change in April 2023 futures for Crude Oil, Live Cattle and Lean Hogs. We weigh the percentage change in those contracts and compute the index's percentage change. Crude Oil accounts for 50% of the index, and Live Cattle and Lean Hogs each make up 25%. To create the chart, we started the index at the Dec22 corn futures settlement on 11/12/21; then added or subtracted the index's weekly percentage change. We want to add a few warnings. First, there are only a handful of data points - not much to go on. Second, the index references relatively illiquid markets - making any strategy based on it challenging to execute. Third, we expect divergences to increase as we get into the growing season when the corn market will likely look more toward supply for its direction. In short, we would not attempt to trade on this information without much more data, nor would we recommend anyone else does.