Weekly Corn Market Update 05/31/24
December 2024 (Dec24) corn futures (the benchmark for 2024 corn production) finished the week lower by 21.25 cents (~4.35%), settling at $4.6700/bushel - posting their largest absolute and percentage changes of the year. This week's price action occurred in a 26.75-cent (~5.48%) range. This week's low was 4.50 cents above the extreme down level we published last week, and the settlement was 5.25 cents above extreme down territory.
Our corn demand index (CDI) fell a mere 0.08% this week, notably outperforming Dec24 corn futures. The war in Ukraine, executive branch policy, tensions with China, Federal Reserve interest rate policy, the Dollar, and instability in the Middle East remain concerns. With planting progress catching up to the five-year average last week (according to the USDA), delayed planting concerns have generally seemed to ease. However, localized pockets of deep concern remain.
Dec24 corn futures remain inside a long-term downtrend channel capped by a trendline connecting the highs of April 20th, 2022, and June 21st, 2023, and supported by a trendline connecting the lows of July 22nd, 2022, and May 18th, 2023. Dec24 corn futures fell out of a short-term uptrend channel formed by connecting the lows of February 26th, 2024, and April 19th, 2024, as the support line and the highs of March 21st, 2024, and May 7th, 2024, as the resistance line. We see technical levels below the market at around $4.57, $4.41, and $4.14/bushel. We see technical levels above the market at about $4.73, $4.86, $5.01, $5.14, $5.25, $5.44, $5.76, $5.90, and $6.02/bushel. Daily and weekly momentum indicators moved into neutral to oversold territory this week. Carry spreads from Dec24 to Mar25, May25, and Jul25 widened this week.
Our at-the-money model volatilities for the 2024 crop finished lower this week. See the charts below for more details. One compares our closing at-the-money model volatilities for this week and last. The other compares our current model volatilities with the forward volatilities they imply between consecutive expirations.
For next week's trading in Dec24 corn futures, we consider trade in the $4.5425-$4.8175 per bushel range unremarkable. Notable moves extend to the $4.3775-$5.0425 per bushel range. Price action beyond that would be extreme.
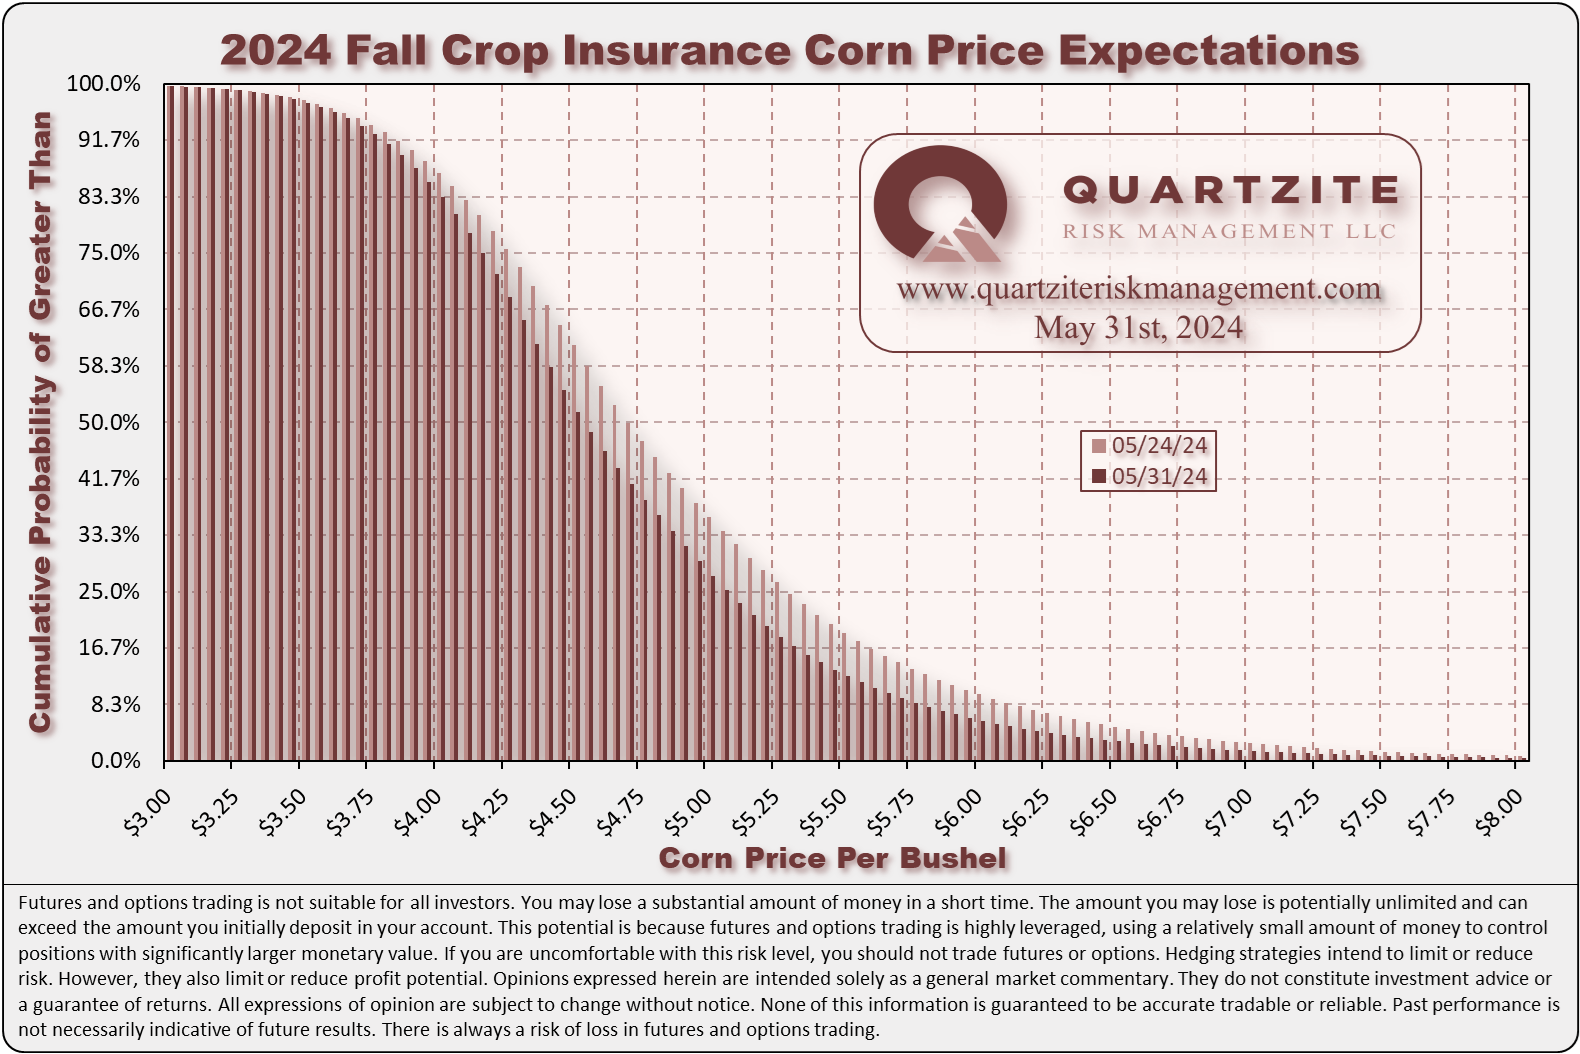
For the fall crop insurance price, we see a median of $4.5250/bushel with a mode between $4.30 and $4.35/bushel. See the crop insurance charts below.
#AgTwitter & #oatt - cast your vote in this week's poll, then click over to read our Weekly #Corn #Market Update: https://t.co/oJL6Egvi2l
— Quartzite James (@QuartziteRMLLC) June 1, 2024
We think these scenarios have roughly equal probability next week. Where do you think #cbot Dec24 corn #futures will settle next week?
Thanks for taking the time to read. We look forward to your questions and feedback. Thanks again.
(970)223-5297 - Email - Contact Form - Twitter - Facebook
Weekly Price Levels and Corn Demand Index


As a reminder, the Quartzite Risk Management Corn Demand Index references the weekly change in April 2025 futures for Crude Oil, Live Cattle and Lean Hogs. We weigh the percentage change in those contracts and compute the index's percentage change. Crude Oil accounts for 50% of the index, and Live Cattle and Lean Hogs each make up 25%. To create the chart, we started the index at the Dec24 corn futures settlement on 11/10/23; then added or subtracted the index's weekly percentage change. We want to add a few warnings. First, there are only a handful of data points - not much to go on. Second, the index references relatively illiquid markets - making any strategy based on it challenging to execute. Third, we expect divergences to increase as we get into the growing season when the corn market will likely look more toward supply for its direction. In short, we would not attempt to trade on this information without much more data, nor would we recommend anyone else does.