Weekly Corn Market Update 03/17/23
December 2023 (Dec23) corn futures (the benchmark for 2023 corn production) finished the week higher by 3.50 cents (~0.63%), settling at $5.6125/bushel. This week's price action occurred in an 11.50-cent (~2.06%) range. All of this week's trading occurred within the unremarkable range we published last week.
Our corn demand index (CDI) underperformed Dec23 corn futures this week - plummeting 6.40%. The ratio of Nov23 soybean futures divided by Dec23 corn futures fell from 2.43 to 2.34. Potential instability in the US financial system, the war in Ukraine, executive branch policy, increasing tensions with China, Federal Reserve interest rate policy, and the Dollar remain concerns.
Depending on one's perspective, Dec23 corn futures remain in either a long-term uptrend originating from the spring lows of 2020 or a medium-term downtrend beginning from the spring 2022 highs. In our opinion, Dec23 futures must hold the area around $5.46/bushel for all but the most-generous technicians to argue that the long-term uptrend remains intact. We see technical levels below the market at around $5.46, $5.14, $4.98, $4.83, $4.63, and $4.20/bushel. We see technical levels above the market at around $5.63, $5.84, $6.03, $6.14, $6.31, $6.55, and $6.78/bushel. Daily momentum indicators settled in neutral territory this week - while weekly momentum indicators settled in neutral to oversold territory. The weekly stochastics continue to display a notable divergence with recent price action. Daily Bollinger Band Bandwidth narrowed this week. Carry spreads from Dec23 to Mar24, May24, and Jul24 widened this week.
Our at-the-money model volatilities for the 2023 crop mostly finished higher this week, with a notable decline in the short-dated April series and a slight decrease in the short-dated June series. Option volatilities remain cheaper than a year ago, especially in near-term, short-dated new crop options. Our primary focus is moving our established options position around to capture market volatility to help offset time decay. See the charts below for more details. One compares our closing at-the-money model volatilities for this week and last. The other compares our current model volatilities with the forward volatilities they imply between consecutive expirations.
For next week's trading in Dec23 corn futures, we consider trade in the $5.4925-$5.7300 per bushel range unremarkable. Notable moves extend to the $5.2700-$5.9550 per bushel range. Price action beyond that would be extreme. Be sure to visit our Twitter page to vote in the poll we typically hold there each week. While you are there, please give us a follow.
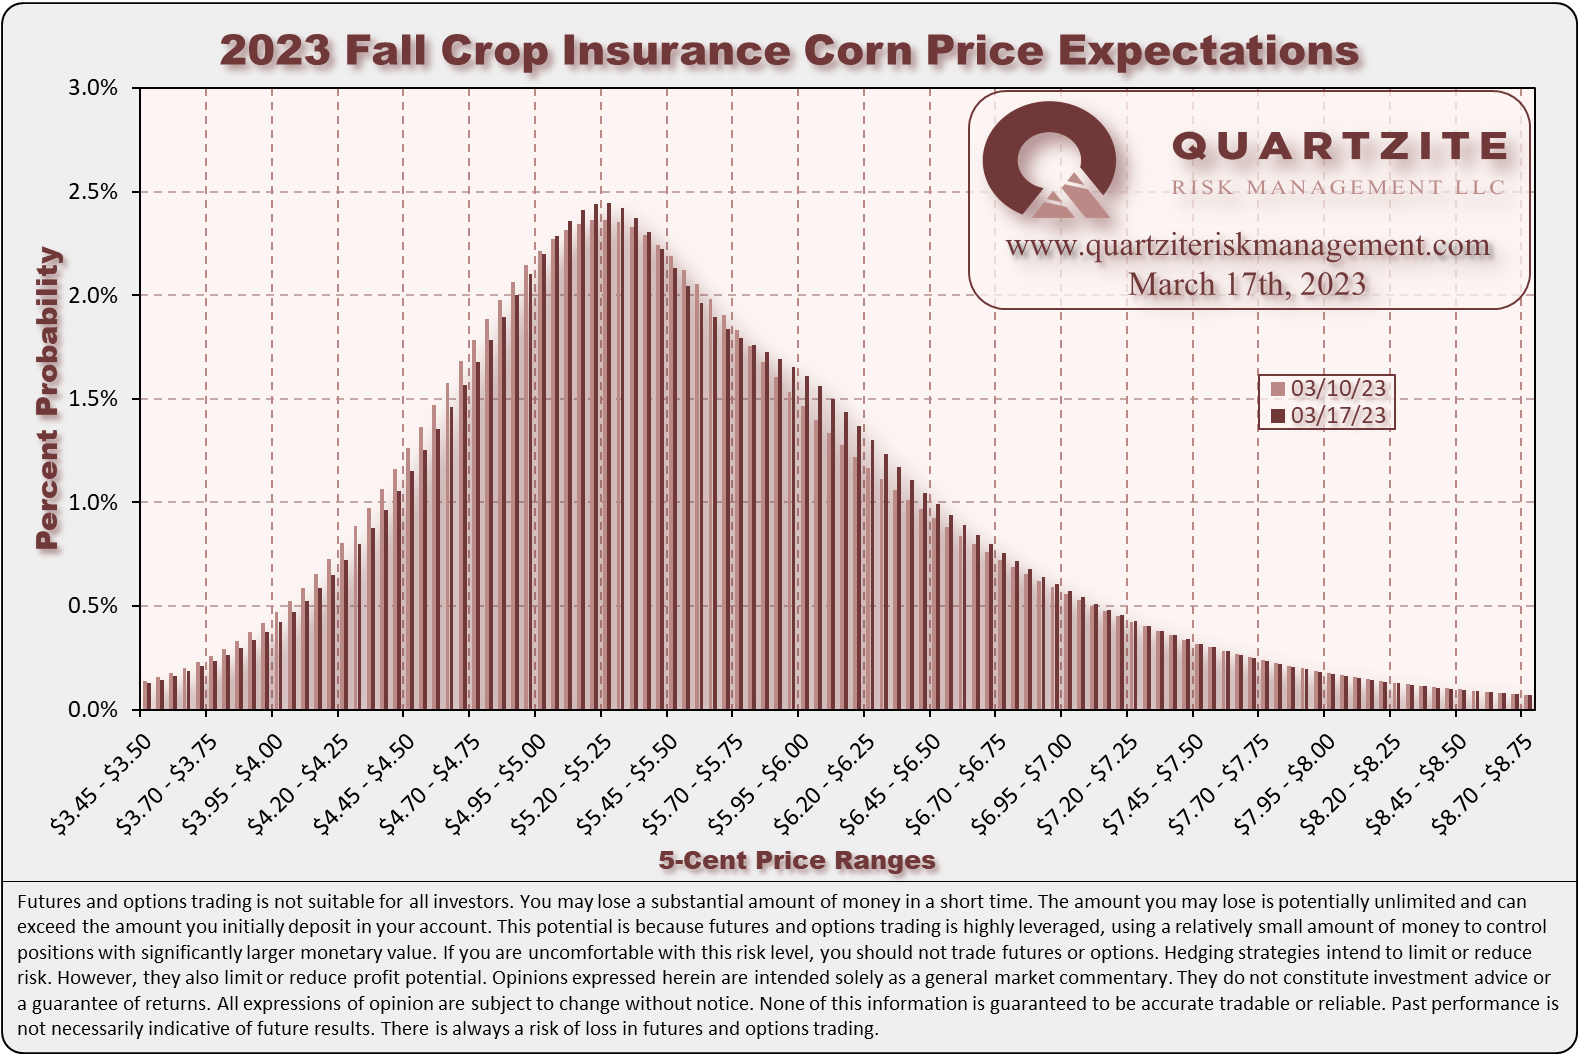
For the fall crop insurance price, we see a median of $5.4475/bushel with a mode between $5.20 and $5.25/bushel. This week our fall price distribution narrowed and shifted slightly higher. See the crop insurance charts below.
This week, we didn't make any corn trades for our Quartzite Precision Marketing customers in the 2023 crop.
There is still time to join our 2023 client roster for our Quartzite Precision Marketing program. If you want to learn more about working with us for the 2023 growing season, reach out.
#AgTwitter & #oatt - cast your vote in this week's poll, then click over to read our Weekly #Corn #Market Update:https://t.co/Vtr57RDMub
— Quartzite Risk Management LLC (@QuartziteRMLLC) March 17, 2023
We think these scenarios have roughly equal probability next week. Where do you think #cbot Dec23 corn #futures will settle next week?
Thanks for taking the time to read. We look forward to your questions and feedback. Thanks again.
(970)223-5297 - Email - Contact Form - Twitter - Facebook
Weekly Price Levels and Corn Demand Index


As a reminder, the Quartzite Risk Management Corn Demand Index references the weekly change in April 2024 futures for Crude Oil, Live Cattle and Lean Hogs. We weigh the percentage change in those contracts and compute the index's percentage change. Crude Oil accounts for 50% of the index, and Live Cattle and Lean Hogs each make up 25%. To create the chart, we started the index at the Dec23 corn futures settlement on 11/04/22; then added or subtracted the index's weekly percentage change. We want to add a few warnings. First, there are only a handful of data points - not much to go on. Second, the index references relatively illiquid markets - making any strategy based on it challenging to execute. Third, we expect divergences to increase as we get into the growing season when the corn market will likely look more toward supply for its direction. In short, we would not attempt to trade on this information without much more data, nor would we recommend anyone else does.