Weekly Corn Market Update 01/14/22
December 2022 (Dec22) corn futures (the benchmark for 2022 corn production) finished the week higher by a half-cent (~0.09%), settling at $5.5825/bushel. This week's price action took place in a 13.50-cent (~2.42%) range. All of this week's trading took place well within the unremarkable range we published last week.
This week, our corn demand index (CDI) rose 2.19%, heavily outperforming Dec22 corn futures. Concerns over COVID-19 in the U.S. continue to drag on. The potential for problems elsewhere in the world and from new strains remains. Uncertain executive branch policy, tensions with China, potential conflict between Russia and Ukraine, Federal Reserve interest rate policy, and its impact on the Dollar remain significant concerns. We believe these factors will continue to provide potential sources of volatility for the foreseeable future. Increased input costs for corn production continue to impact acreage decisions this year, representing a significant upside risk. The USDA released a large amount of data on Wednesday, and the new-crop corn market mostly shrugged it off.
Dec22 corn futures remain in a long-term uptrend supported by a trendline connecting the lows of 03/31/21 and 09/10/21. Additionally, significant support rests below the market between $5.25 and $5.30 per bushel. Most daily and weekly momentum indicators display neutral to slightly-overbought readings. Bollinger Bands continue to squeeze on the daily chart, which could indicate a potential breakout in either direction from the narrow range that has dominated recent trading. Carry spreads from Dec22 to Mar23, May23, and Jul23 widened this week.
Implied volatilities for the 2022 crop fell this week but remain high relative to recent years before the 2021 crop year. We continue to believe that the Dec22 options series represents the best value for long-term hedgers. See the charts below for more details. One compares our closing at-the-money model volatilities for this week and last. The other compares our current model volatilities with the forward volatilities they imply between consecutive expirations.
Looking ahead to next week's trading in Dec22 corn futures, we would consider movement within the $5.4575-$5.7125 per bushel range to be unremarkable. Notable moves would extend to the $5.3250-$5.8550 per bushel range. Price action beyond that would be extreme. Be sure to visit our Twitter page to vote in the poll we hold there each week. While you are there, please give us a follow.
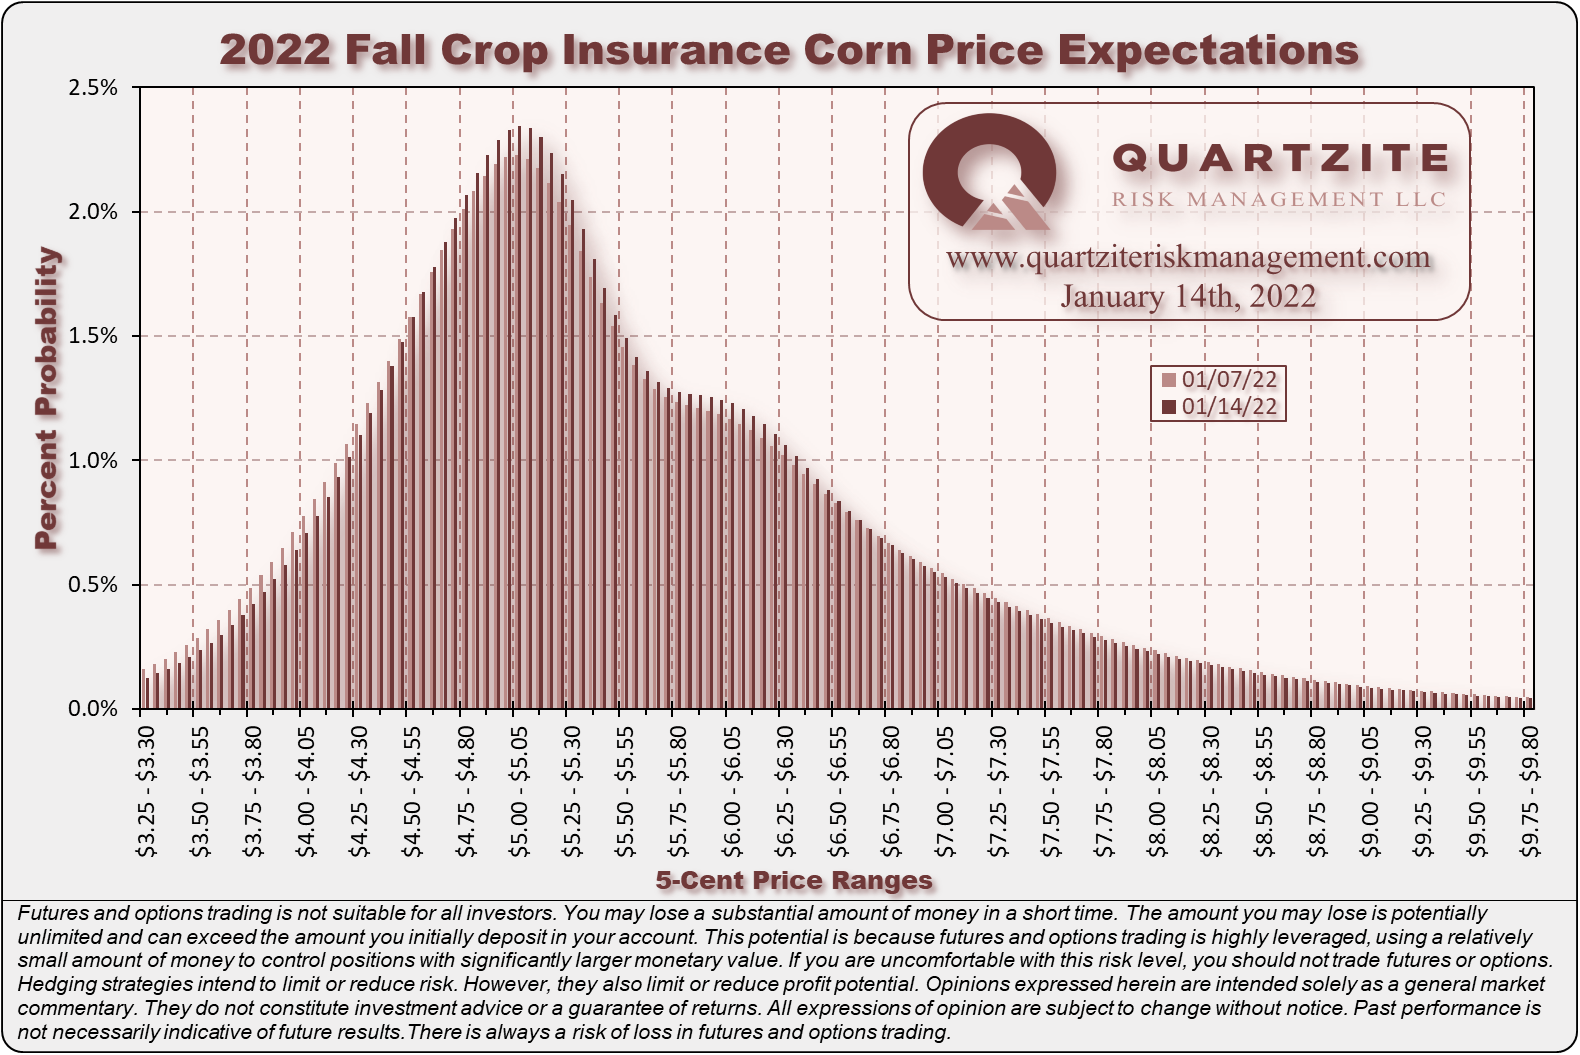
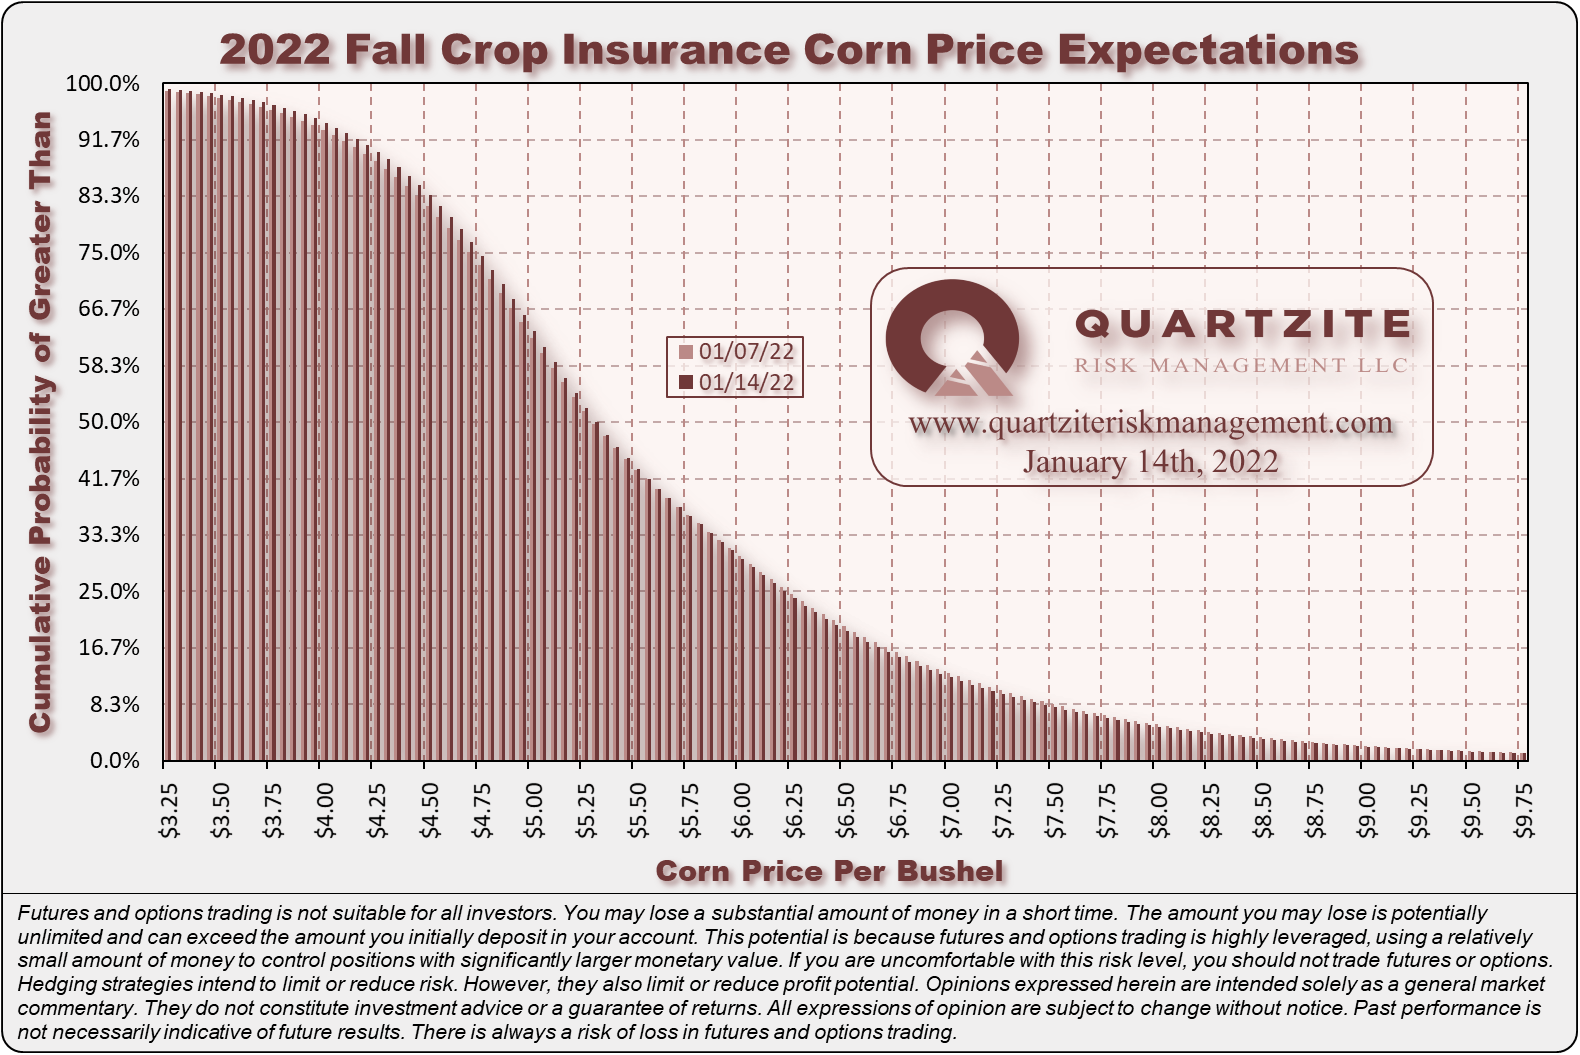
This week our median Fall Price estimate is $5.3025 per bushel, with a mode between $5.00 and $5.05 per bushel. Our median spring price estimate is $5.5675 per bushel, with a mode between $5.50 and $5.55 per bushel. Both distributions narrowed this week due to the decrease in implied volatility.
We have done small amounts of hedging for our Quartzite Precision Marketing customers for the 2022 season. Mainly, we have recommended cash contracting portions of 2022 production as producers lock in their input costs. Additionally, we have made small purchases of put options as market liquidity allows. We made another small put purchase before the USDA's release this week. We believe, even despite the uptrend in Dec22 corn futures, producers should protect their investment in expensive inputs with a disciplined and flexible risk management strategy. There is still time to consider your 2022 marketing plan. If you have any questions or want to learn more about what we do, please reach out. We are always happy to chat about the markets, and there is no obligation.
#AgTwitter & #oatt - cast your vote in this week's poll, then click over to read our Weekly #Corn #Market Update:https://t.co/n8djytXABB
— Quartzite Risk Management LLC (@QuartziteRMLLC) January 15, 2022
We think these scenarios are equally likely for next week. Where will Dec22 corn #futures settle?
Thanks for taking the time to read. We look forward to your questions and feedback. Thanks again. Have a great week.
(970)294-1379 - Email - Contact Form - Twitter - Facebook
Weekly Price Levels and Corn Demand Index


As a reminder, the Quartzite Risk Management Corn Demand Index references the weekly change in April 2023 futures for Crude Oil, Live Cattle and Lean Hogs. We weigh the percentage change in those contracts and compute the index's percentage change. Crude Oil accounts for 50% of the index, and Live Cattle and Lean Hogs each make up 25%. To create the chart, we started the index at the Dec22 corn futures settlement on 11/12/21; then added or subtracted the index's weekly percentage change. We want to add a few warnings. First, there are only a handful of data points - not much to go on. Second, the index references relatively illiquid markets - making any strategy based on it challenging to execute. Third, we expect divergences to increase as we get into the growing season when the corn market will likely look more toward supply for its direction. In short, we would not attempt to trade on this information without much more data, nor would we recommend anyone else does.